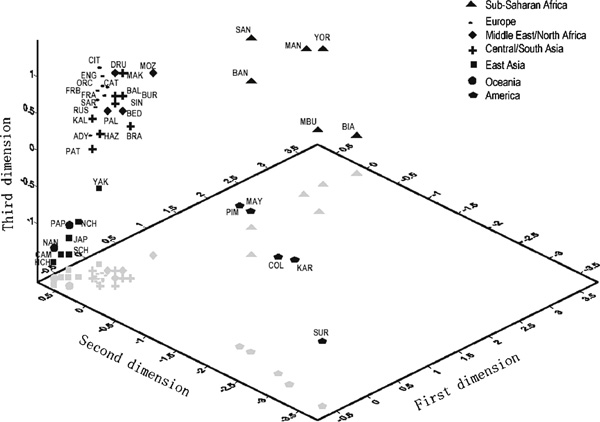
Figure 1.

Plot of first three dimensions obtained in the correspondence analysis based on the 182 shared haplotypes found in 40 populations (English population included). The first dimension separates the six African populations from the rest. Native Americans are clearly differentiated in the second dimension and East Asians and Oceanians are separated from the rest of Eurasian populations by the third dimension.
