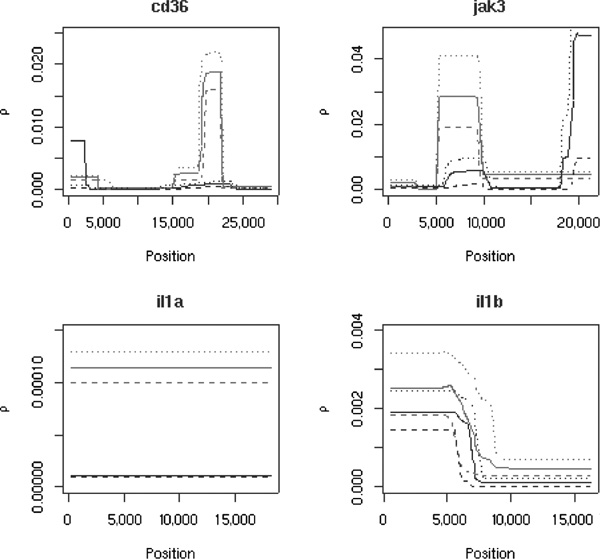
Figure 5.

Recombination rate profiles for four different genes. The results obtained from the African-derived sample are shown in grey, those from the European-derived sample are in black. The solid lines indicate the mean values for the local values of ρ, while the dashed lines show the 2.5 and 97.5 percentiles obtained from the recombination rate estimator. In each case, the profiles of the quantiles are very similar to those of the average behaviour; all curves show comparable levels of recombination rate variation. Note that the recombination profiles in the two populations are vertically shifted, but areas of local change occur in similar positions across the genes.
