Figure 1.
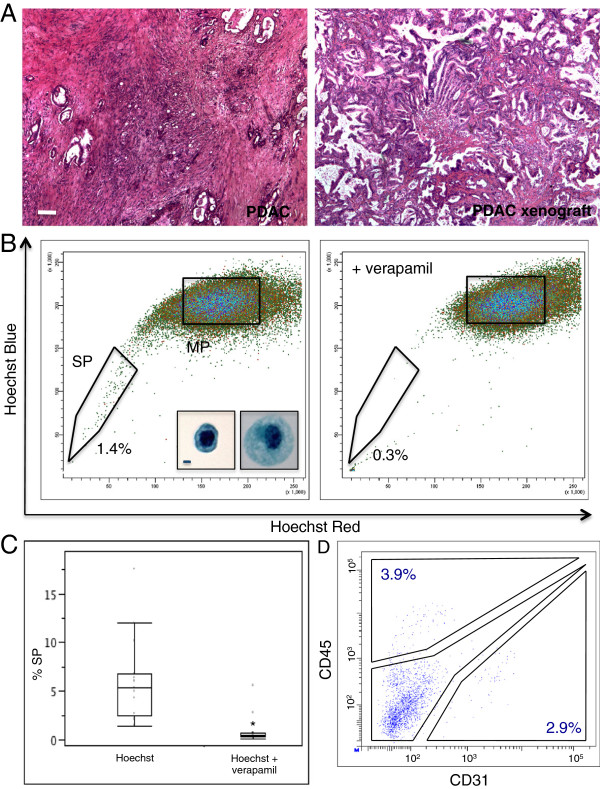
A SP is present in human PDAC. (A) Hematoxylin-Eosin staining of an original PDAC sample (left) and the corresponding xenograft tumour (right). A representative example is shown. Scale bar = 50 μm. (B) SP identification by FACS (left) and control of the SP phenotype with verapamil (right). A representative example with SP proportions is displayed. Inserts show a SP cell (left) and a MP cell (right) after Cyto Rich Red staining. Scale bar = 1 μm. (C) Boxplot of the SP proportion, with and without verapamil, of all PDAC xenografts analyzed (n = 17). *, p < 0.05. (D) Analysis of CD45 and CD31 expression in the PDAC xenograft SP using FACS. A representative example is shown. Numbers represent the percentage of CD45+ cells and of CD31+ cells within the SP.

