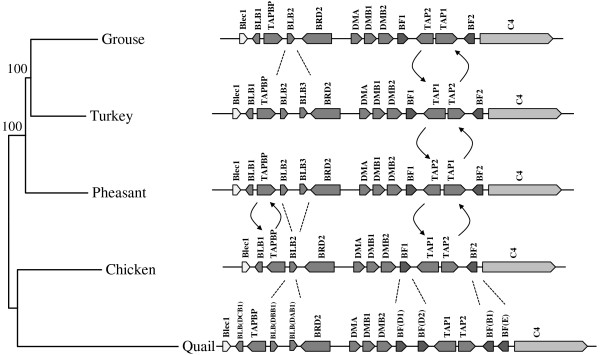
Figure 3.
Phylogenetic relationship and structural comparison of the MHC-B regions of black grouse, chicken, turkey, quail and golden pheasant. The phylogenetic tree is constructed with the Neighbor-joining method. Numbers next to the branch points indicate the bootstrap values as percentages of 1000 replicates. Pseudogenes of the quail MHC-B are not shown. Arrows and dotted lines highlight inversions and duplications. Numbers beside the arrows indicate the positions of the breakpoints on the compared sequences. Accession numbers: black grouse (JQ028669), chicken (AB268588), turkey (DQ993255), quail (AB078884), golden pheasant (JQ440366). Different shading of genes indicate different MHC gene families defined from human MHC. From dark to light: Class I, Class II, Class III, others.

