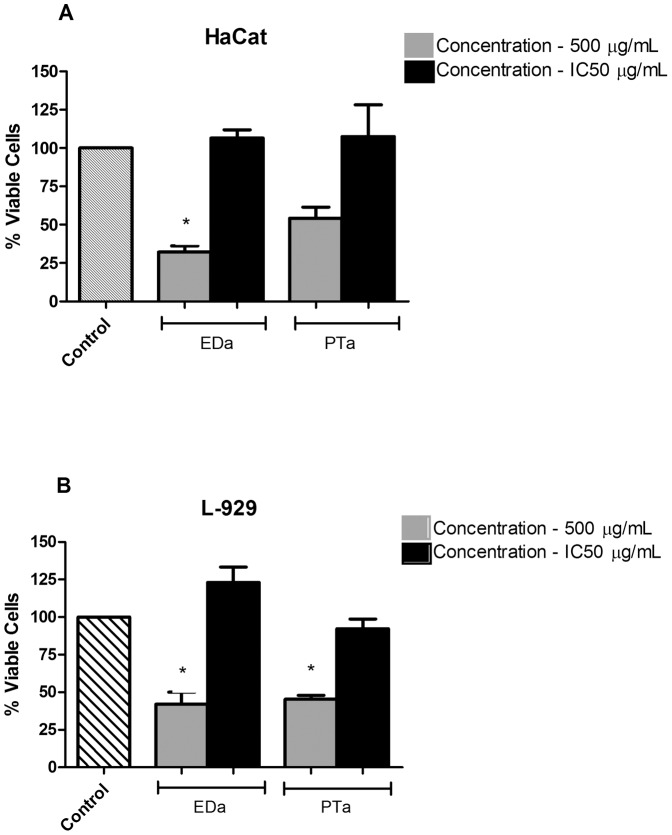
Figure 4. Cytotoxicity assay of keratinocyte (HaCat) and fibroblast (L-929) cell lines.
Cells were treated with extracts at the concentration of 500 µg/mL and IC50 value. Results depict average of three independent experiments, each performed in triplicate. Treatment was conducted for 24 h. Control was normalized to 100%. *p<0.05 vs control. Crude extracts: EDa- Eugenia dysenterica (aqueous); PTa - Pouteria torta (aqueous).

