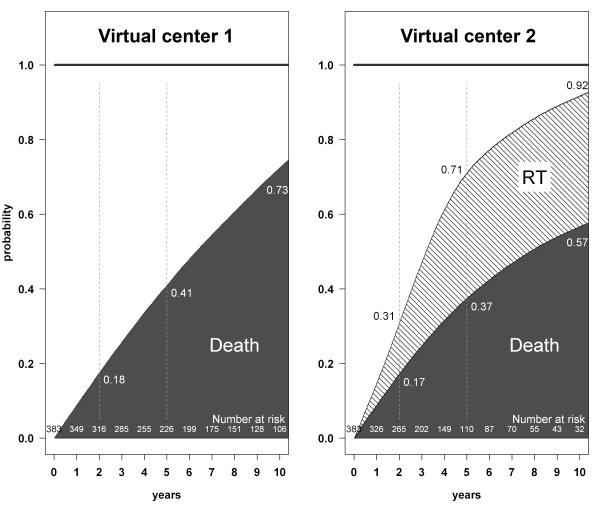
Figure 4.
Cumulative incidence of death and renal transplantation for two simulated dialysis populations with exactly the same probability of death, obtained by the competing risks method. The only difference between the two virtual centers is whether renal transplantation (RT) is available (center 2) or not (center 1). Dashed vertical lines show the estimates at 2, 5, and 10 years for each center.

