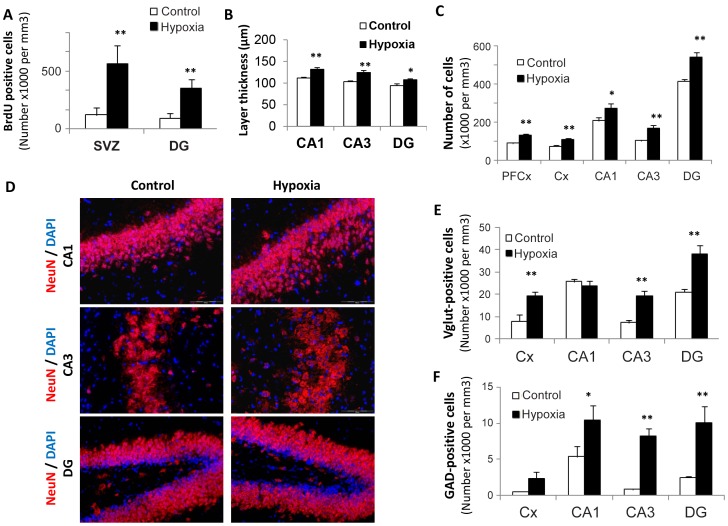
Figure 2. Medium-term changes in 21-day-old rat brains after transient neonatal hypoxia.
(A) Number of BrdU-positive cells recorded in the subventricular zone and in the dentate gyrus of control rats and those exposed to brief hypoxia after birth. Results are expressed as cell numbers per mm3 (n = 5). Statistically significant difference between hypoxia and controls: **P<0.01. (B,C) Layer thicknesses (µm) and cell numbers per mm3 in various brain structures (CA1, CA3 = hippocampus Hammon’s horn layers; DG = dentate gyrus, Cx = frontal cortex, PFCx = prefrontal cortex), n = 5, *P<0.05, **P<0.01. (D) Immunohistochemical staining of NeuN, a marker of mature neurons, in various hippocampus layers showing hypoxia-associated increases in thickness and/or cell densities. Cells were counterstained by Dapi (x20 magnification). (E,F) Numbers of glutamatergic (VGluT2-positive) cells and of GABAergic (GAD65-positve) cells in various brain structures, n = 5, *P<0.05, **P<0.01.

