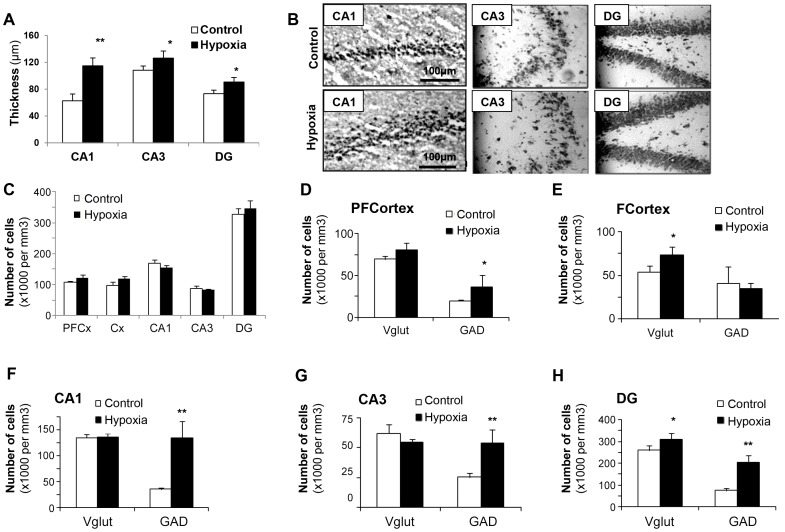
Figure 5. Effects of neonatal hypoxia on brain histological characteristics in 720-day-old male rats.
(A–C) Layer thicknesses (µm), illustrations in the hippocampus layers after tissue coloration by thionine, and cell numbers per mm3 in various brain structures, n = 5, *P<0.05, **P<0.01. (D–H) Numbers of glutamatergic (VGluT2-positive) cells and of GABAergic (GAD65-positve) cells in various brain areas of control and hypoxic male rats (PFCortex = prefrontal cortex, FCortex = frontal cortex, DG = dentate gyrus), n = 5, *P<0.05, **P<0.01.

