
Figure 1.
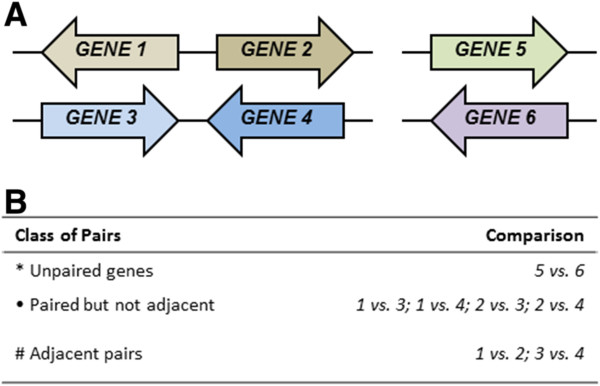
Classification of pairing relationships compared in this study. The members of a hypothetical regulon comprised of six genes (A) and the classification of the pairings used for the determination of the average Pearson’s correlation coefficient (B).