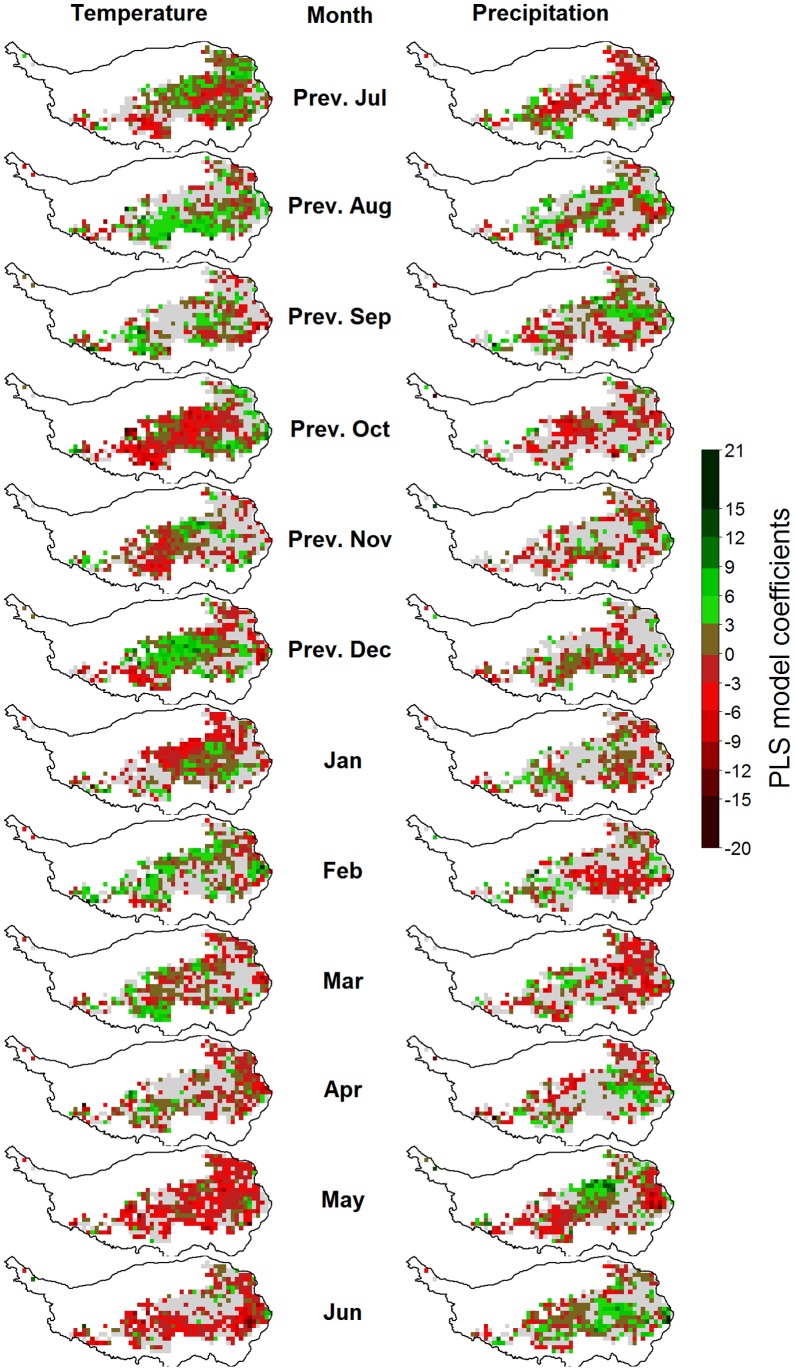
Figure 8. Correlations of monthly temperatures (left) and precipitation (right) with the beginning of the growing season (BGS) on the Tibetan Plateau, according to Partial Least Squares (PLS) regression.
For each variable, pixels for which the variable-importance-in-the-projection score was<0.8 are shown in gray. Pixels with insufficient data for PLS analysis are shown in white.

