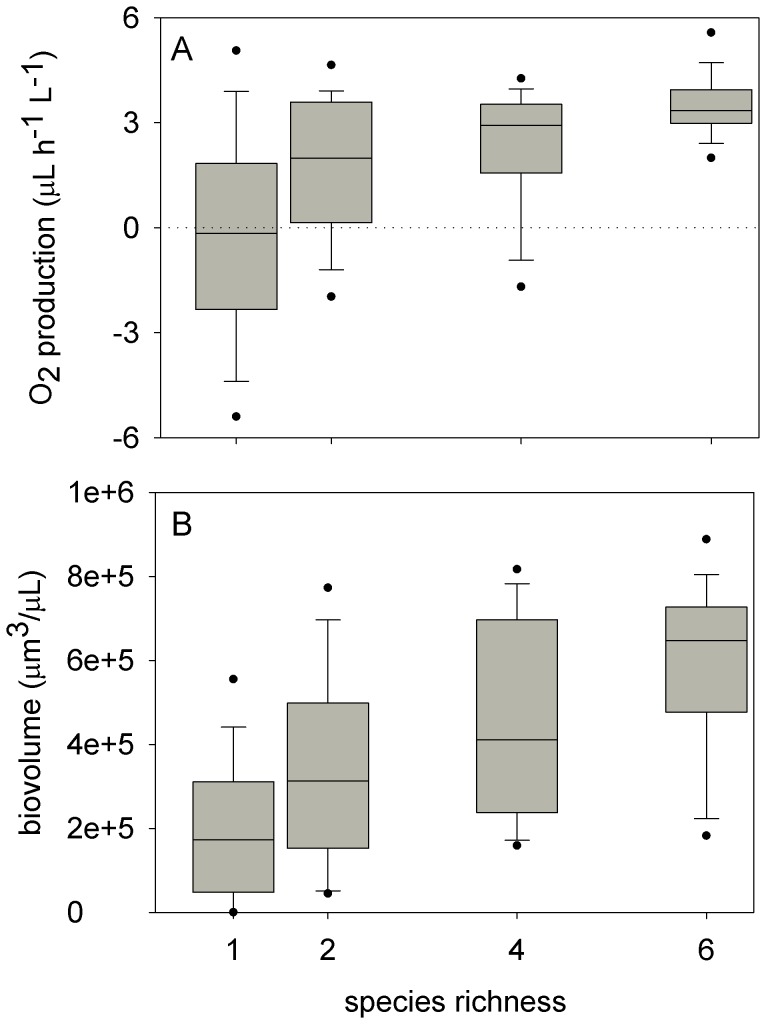
Figure 1. Net oxygen production (A) and total biovolume (B) of phytoplankton monocultures and polycultures.
Each box displays the experiment-long median (line within box), 25th and 75th percentiles (box boundaries), 10th and 90th percentiles (lower and upper error bars) and 5th and 95% percentiles (dots). Medians and percentiles were calculated using all data collected throughout the experiment (n = 54 for polycultures, 108 for monocultures). Net oxygen production in the monocultures was centered on zero due to the consumption of oxygen after rotifer addition (see Figure 3A).

