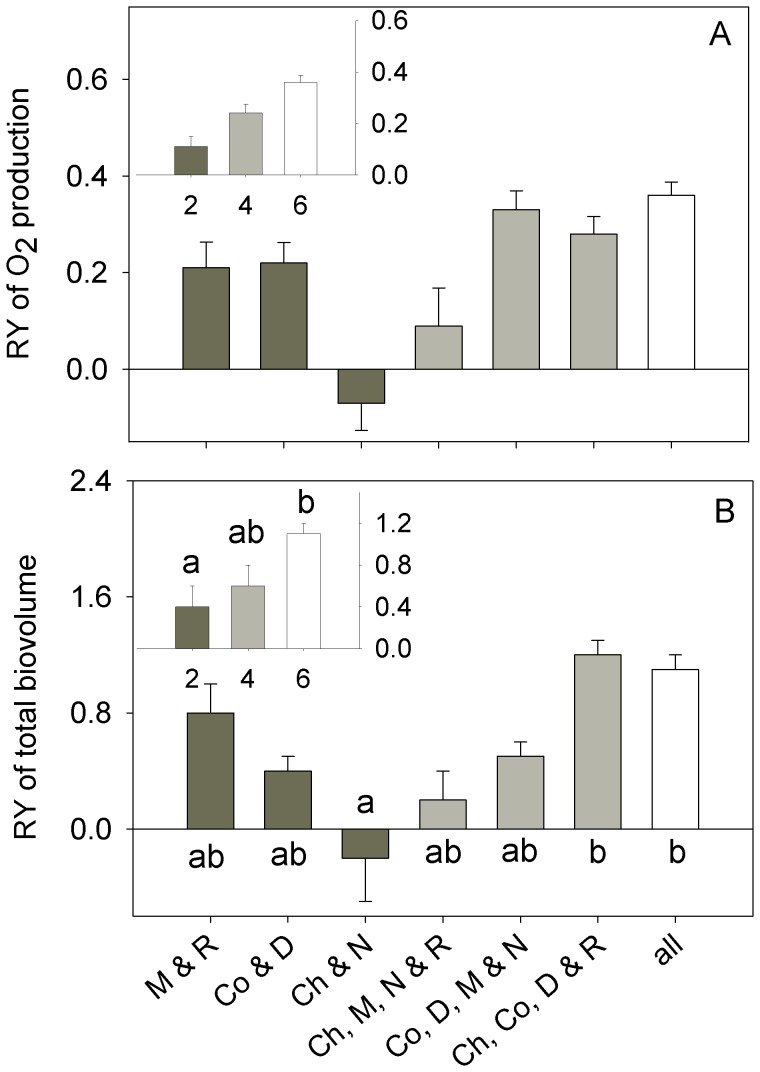
Figure 2. Relative yield of net oxygen production (A) and total biovolume (B).
The main plots compare species combinations whereas the insets compare levels of species richness. Bars represent experiment-long means (± SE) calculated for each replicate and sampling day. Letters above each bar indicate the results of the post-hoc Tukey tests associated with ANOVA. Species combinations are listed with each plot, using the following abbreviations: D – Dunaliella, N – Nannochloris, R – Rhodomonas, Ch – Chaetoceros, Co – Coscinodiscus, M – Melosira and all – all species in the six-species combination.

