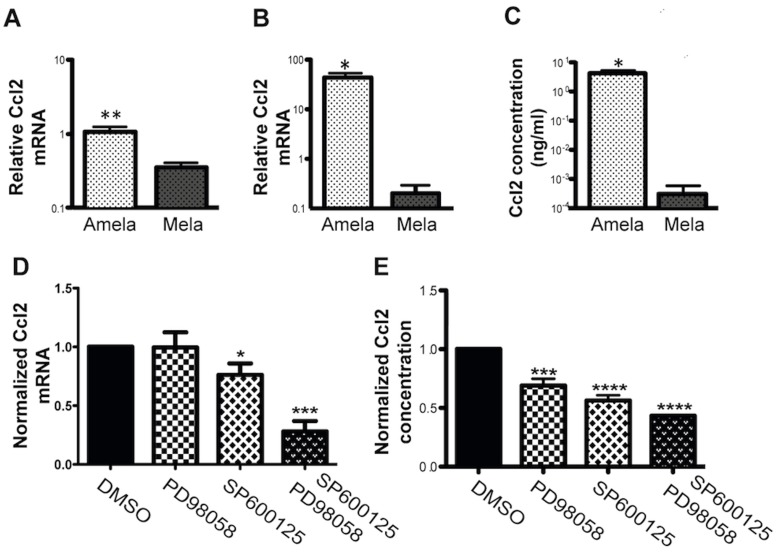
Figure 6. Specific expression of Ccl2 in Amela tumors is controlled by Ras signalling pathways.
(A-B) QRT-PCR analysis of Ccl2 transcript expression in induced Mela and Amela primary tumors (A) and in the corresponding cell lines in vitro (B). (C) Concentration of secreted Ccl2 in the supernatant of 24 h cultures of Amela and Mela cell lines as measured by ELISA. (D) Expression of Ccl2 transcript by QRT-PCR and (E) concentration of secreted protein by ELISA, in the absence (value set to 1) or presence of inhibitors in 24 h cultures, as indicated. (A–C) Amela tumors are represented by white dotted bars and Mela tumors by black dotted bars. For primary tumor analysis (A) 6 samples of each tumor were analyzed. For in vitro analysis (B), values were normalized to those for B16F10 cells. In (C), supernatants from 24 h cell cultures were tested and values are expressed as ng/ml. In D–E, culture conditions were as described in Methods. Experiments involved 10 Amela lines in (D) and 4 in (E). ****p value < 0.0001; ***p value < 0.001; **p value < 0.01; *p value < 0.05.

