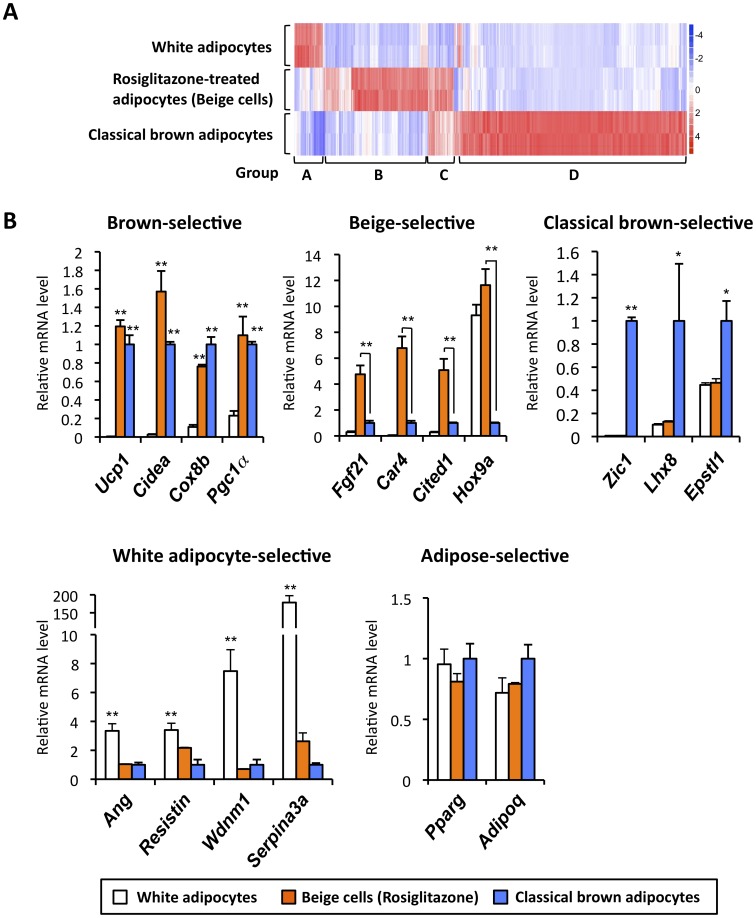
Figure 1. Distinct molecular signatures in Myf-5 derived classical brown adipocytes and non-Myf-5 derived beige cells.
(A) Microarray analysis was performed in fully differentiated brown adipocytes from interscapular BAT (classical brown adipocytes), white adipocytes isolated from inguinal WAT and rosiglitazone-treated adipocytes (beige cells). The color scale shows the fold changes in mRNA expression levels of the genes in blue (down-regulation)-white-red (up-regulation) scheme. (B) mRNA levels for the indicated genes were analyzed by qRT-PCR. Relative expression levels in the brown adipocyte were set as 1.0. * P<0.05, **P<0.01. Data are expressed as means ± SD.

