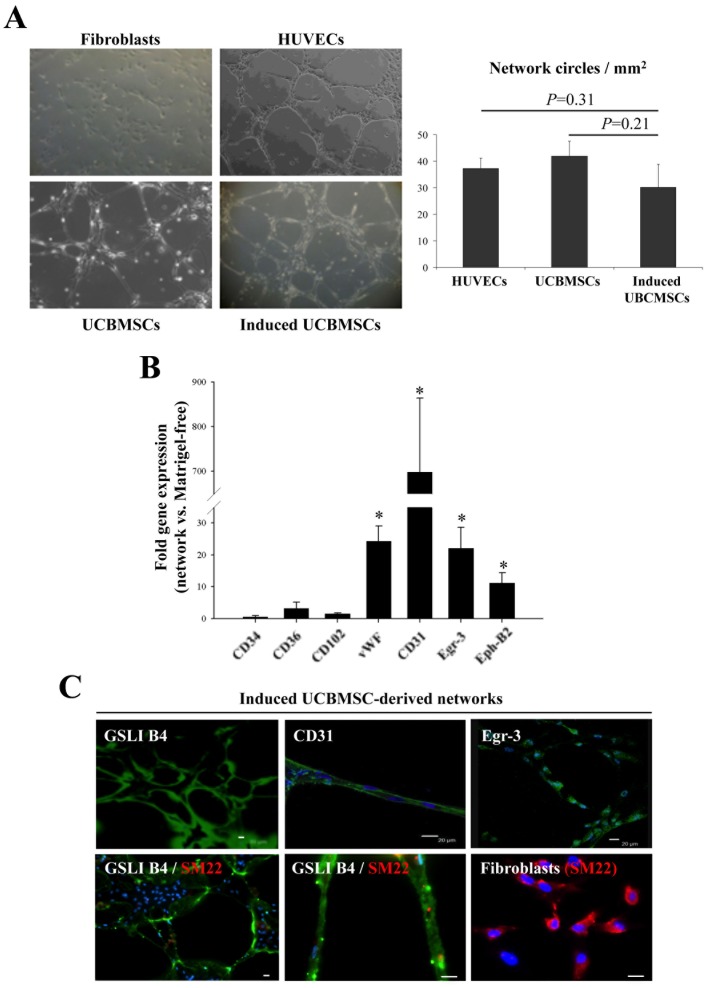
Figure 2. Matrigel-mediated induction of self-assembled cell networks by UCBMSCs.
A) Representative images of cell networks generated by both control and EGM-2-induced UCBMSCs during 5 h in Matrigel. Primary fibroblasts and HUVECs were used as negative and positive controls, respectively. Histogram represents pro-angiogenic capacity measured as the number of regular network circles per mm2 from three independent experiments. B) Analysis of gene transcription by qRT-PCR comparing induced UCBMSC networks and the same cells in Matrigel-free conditions. C) Representative green-fluorescence images showing, top row (left to right): biotynilated GSLI B4 staining, specific detection of surface CD31, and nuclear Egr-3 in self-assembled cell networks developed by UCBMSCs; bottom row (left to right): GSLI B4 and SM22 staining of UCBMSC-derived network (left), higher magnification of previous image (middle), and SM22 staining in human fibroblasts (right). Nuclei were labelled blue with Hoechst. *P<0.05 and Bars = 20 µm.

