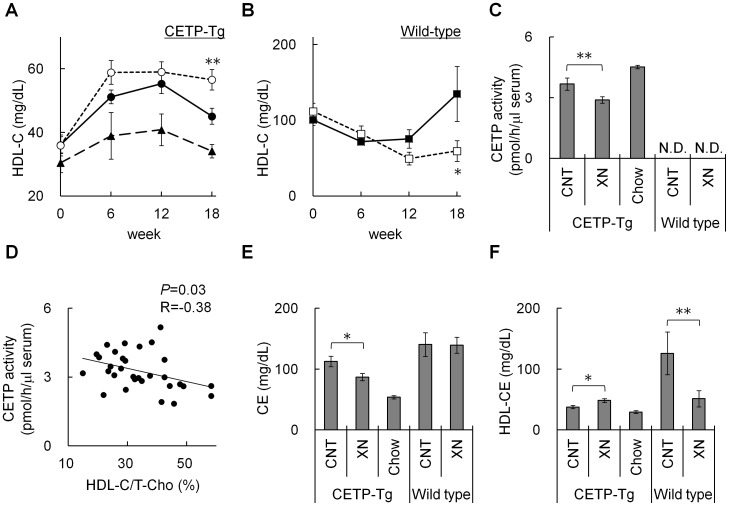
Figure 2. Effect of xanthohumol on serum cholesterol and CETP activity.
Serum HDL-C concentration in the control group (closed circle), xanthohumol group (opened circle) and Chow group (closed triangle) of CETP-Tg mice (A), and in the control group (closed square) and xanthohumol group (opened square) of wild-type mice (B) over time. (C) Serum CETP activity after 18 weeks of treatment. (D) Correlation of serum CETP activity and HDL-C/T-Cho (%) in CETP-Tg mice fed HCD after 18 weeks. CE content of serum (E) and HDL-fraction (F) after 18 weeks. (N = 15; CETP-Tg mice control, N = 16; CETP-Tg mice xanthohumol, N = 10; CETP-Tg mice Chow, N = 3; wild-type mice control, N = 8; wild-type mice xanthohumol) Means±SEM. *P<0.05, **P<0.01.

