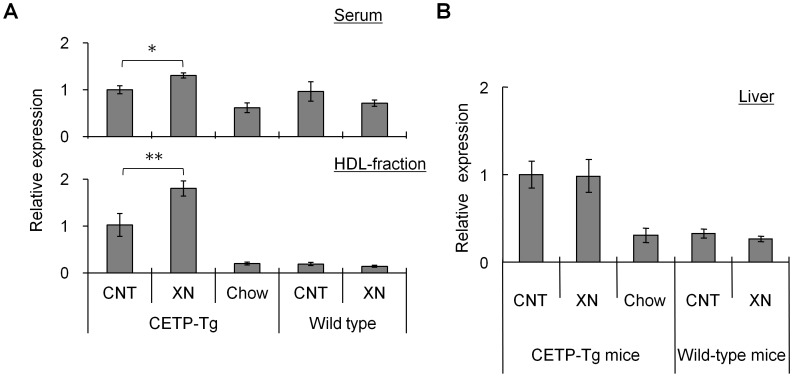
Figure 3. Xanthohumol increased apoE protein expression in CETP-Tg mice after 18 weeks.
(A) Serum (upper) and HDL-fraction (lower), and (B) liver tissue. Data are represented as relative expression: the CETP-Tg mice control group was set at 1.0. (N = 8; CETP-Tg mice control, N = 8; CETP-Tg mice xanthohumol, N = 3; CETP-Tg mice Chow, N = 6; wild-type mice control, N = 7; wild-type mice xanthohumol) Means±SEM. *P<0.05, **P<0.01.

