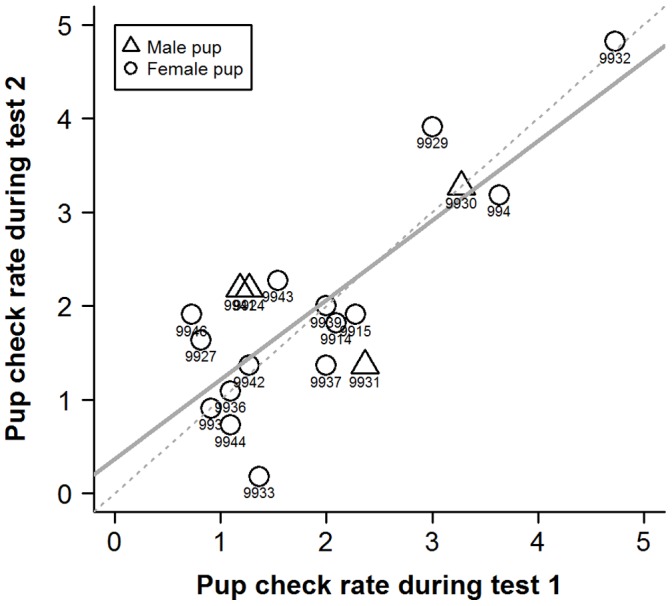
Figure 2. The high degree of repeatability of individuals’ pup-checking rates (min−1) in response to the RCV test across the two time points in the 2009 breeding season.

Test 1 was conducted early in lactation, test 2 late in lactation. Numbers denote individual identities, solid line is line of best fit and dashed line is 1∶1 line. Adapted from Twiss et al. [31].
