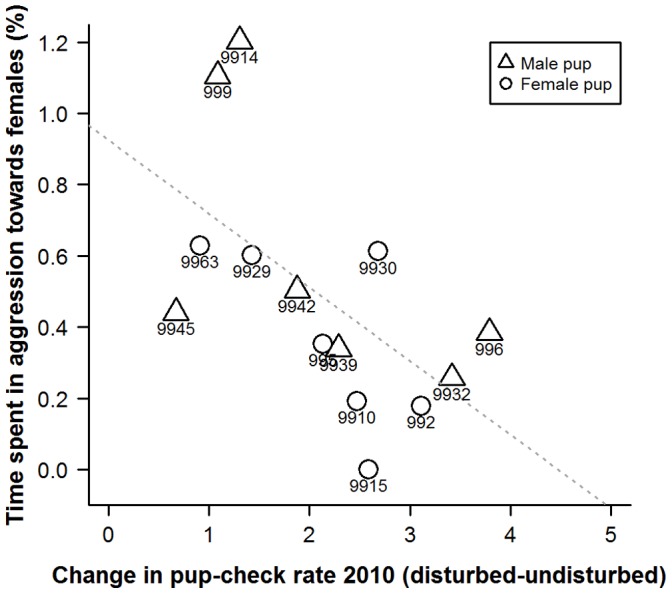
Figure 9. Scatterplot of percentage of time that mothers spent in aggression towards other females and the degree of change in mother’s pup-checking rate (min−1) from undisturbed to disturbed situations.

Numbers represent individual mother identities. Dashed line represents line of best fit.
