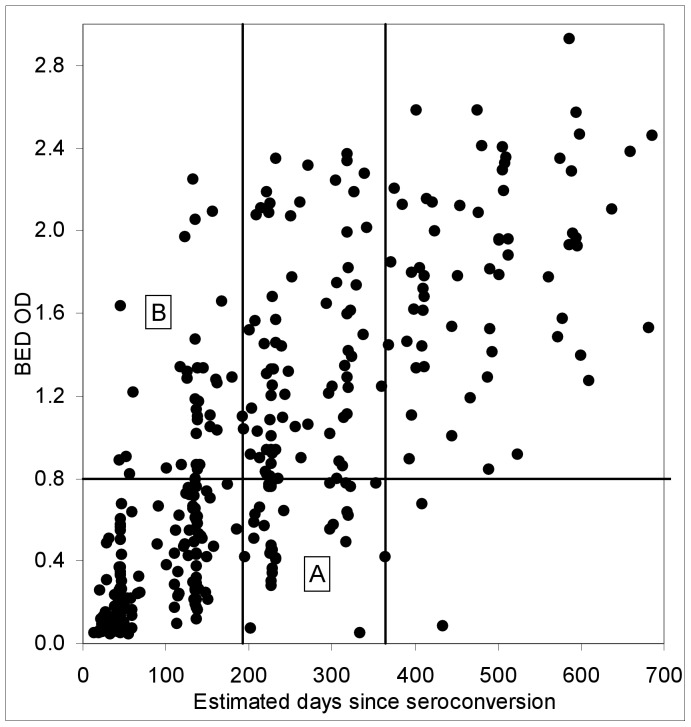
Figure 4. Graphical approach for estimating the mean recency duration.
The graph shows a scatter plot of all BED OD values obtained from seroconverting women from the ZVITAMBO study, where the time between the last negative and first positive HIV tests did not exceed 120 days and where the woman provided at least four HIV positive samples. Horizontal line marks a pre-set OD cut-off of 0.8; vertical lines mark a pre-set cut-off of T = 365-days and a line whose position can be varied until the number of points in rectangles A and B are the same. Points in the other four rectangles are not used in this estimating procedure.

