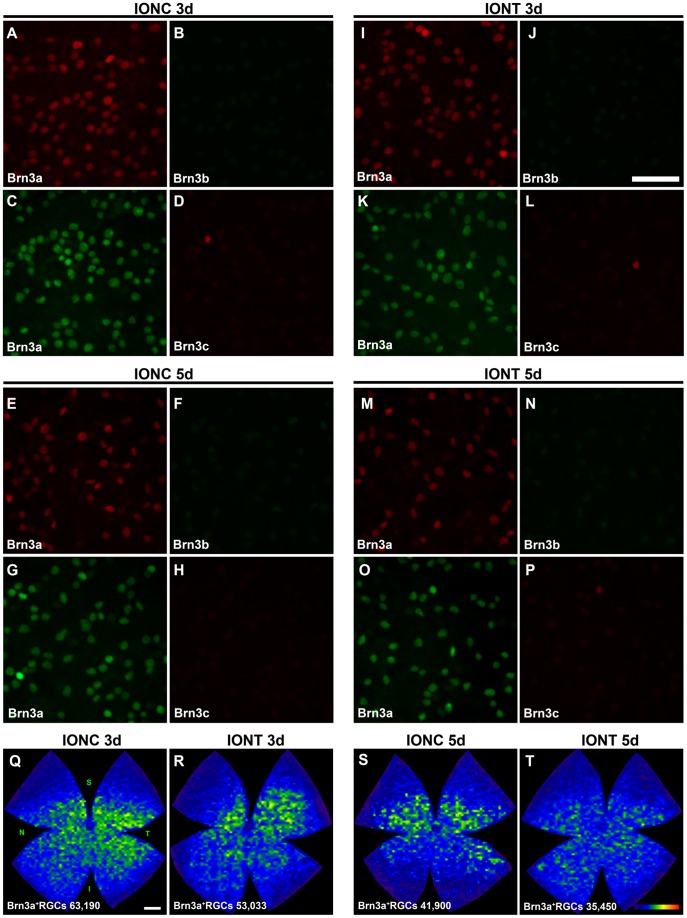
Figure 7. Brn3b and Brn3c expression is rapidly lost after optic nerve injury.
A-P: Magnifications from SD flat mounted retinas analyzed 3 and 5 days after intraorbital nerve crush (A–H) and intraorbital nerve transection (J–P). As internal control, Brn3a was double immunodetected with Brn3b (A–B, E–F, I–J, M–N) or with Brn3c (C–D, G–H, K–L, O–P). In these images is observed that Brn3b and Brn3c expression decreases already 3 days after both injuries. This low signal impeded the automated quantification of Brn3b and Brn3c positive RGCs. Brn3a+RGCs were counted in these retinas and isodensity maps showing the distribution of the surviving RGCs were created (Q–T, at the bottom of each map is shown the number of Brn3a+RGCs counted in the retina wherefrom the map has been generated). These maps illustrate that IONT induces a quicker loss of RGCs than IONC, as evidenced by the higher densities observed in Q and S than in R and T. Colour scale (T bottom right) is the same as in figure 4M. Four (IONC 5d) or five (rest of the groups) retinas were analyzed per marker. Bars: 50 µm (J), 1 mm (Q).

