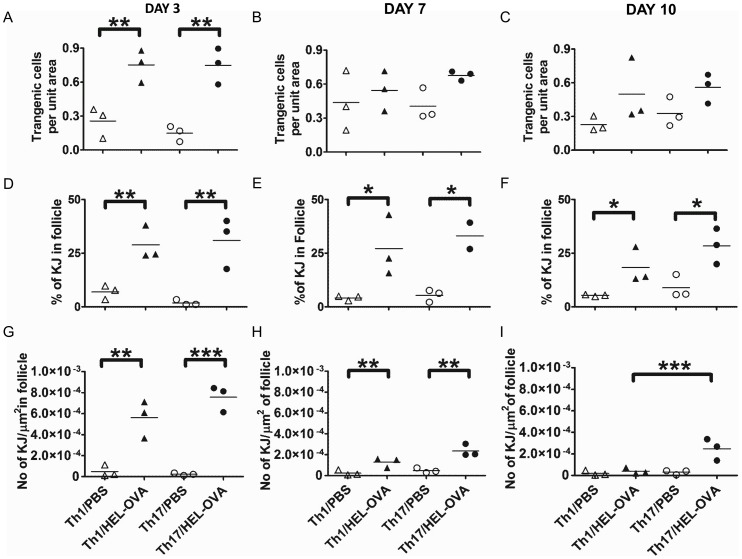
Figure 7. Relative ability of Th1 and Th17 populations to localise in the follicle.
On days 3 (A), 7(B) and 10 (C) post-immunisation, the relative ability of the transgenic T cells to localise in the follicular area was quantified in situ by immunofluorescence staining using the Volocity® software as described in materials and methods and Fig S1. The percentage of the total transgenic T cells of the section that reside in the follicle (D–F) and the number of transgenic T cells per unit area of follicle (G–H) in the same time points are also presented. At least three sections were analysed from each animal and each point represents the mean of that. *p<0.05, **p<0.01, ***p<0.001 (n = 3). Similar results were obtained in one additional experiment.

