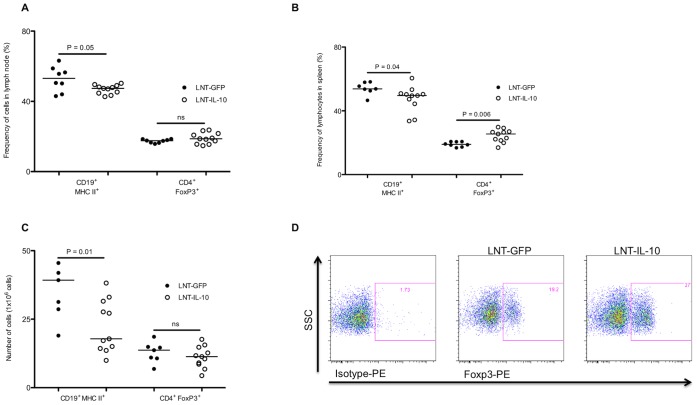
Figure 4. T and B cell populations in lymph nodes and spleen after CII immunisation.
(A) Percentages of CD19+MHCII+ cells and CD4+FoxP3+ cells in lymph node, (B) and in spleen (C) Absolute numbers of CD19+MHCII+ cells and CD4+FoxP3+ cells in spleen. (D) Typical gating for isotype control and Foxp3 antibody in CD4+T cells from a LNT-GFP and a LNT-IL-10 mouse. All data were analysed by MannWhitney U-test. Closed circles represents LNT-GFP and open circles LNT-IL-10 mice.

