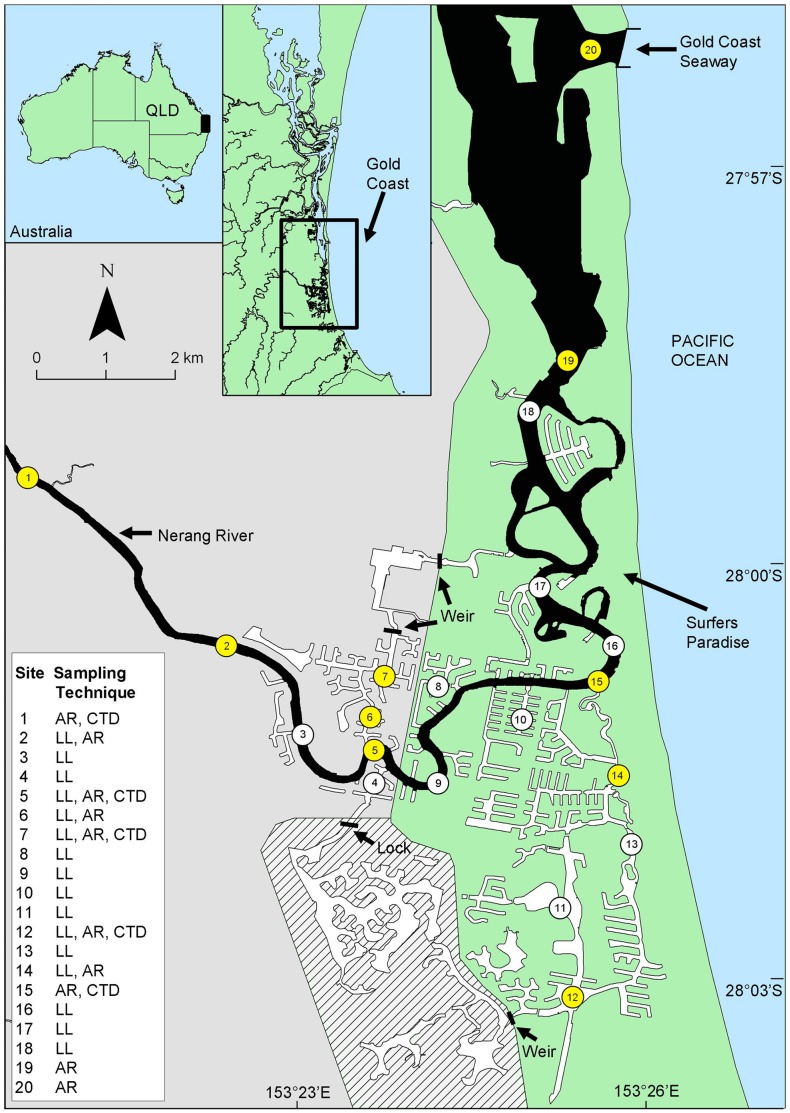
Figure 1. Gold Coast Canal system.
Map illustrating the location of the Nerang River (natural habitat) and Broadwater (in black) and adjoining canal systems (artificial habitat) (in white). Green and grey section of main map illustrates the approximate delineation of low (grey) and high (green) saline areas and upper (grey) and lower (green) river and canals. Numbers indicate the locations of longline surveys (LL), acoustic receivers (AR- highlighted in yellow) and conductivity temperature and depth meters (CTD). Lined area indicates freshwater separated from the artificial and natural habitats by a weir and lock.

