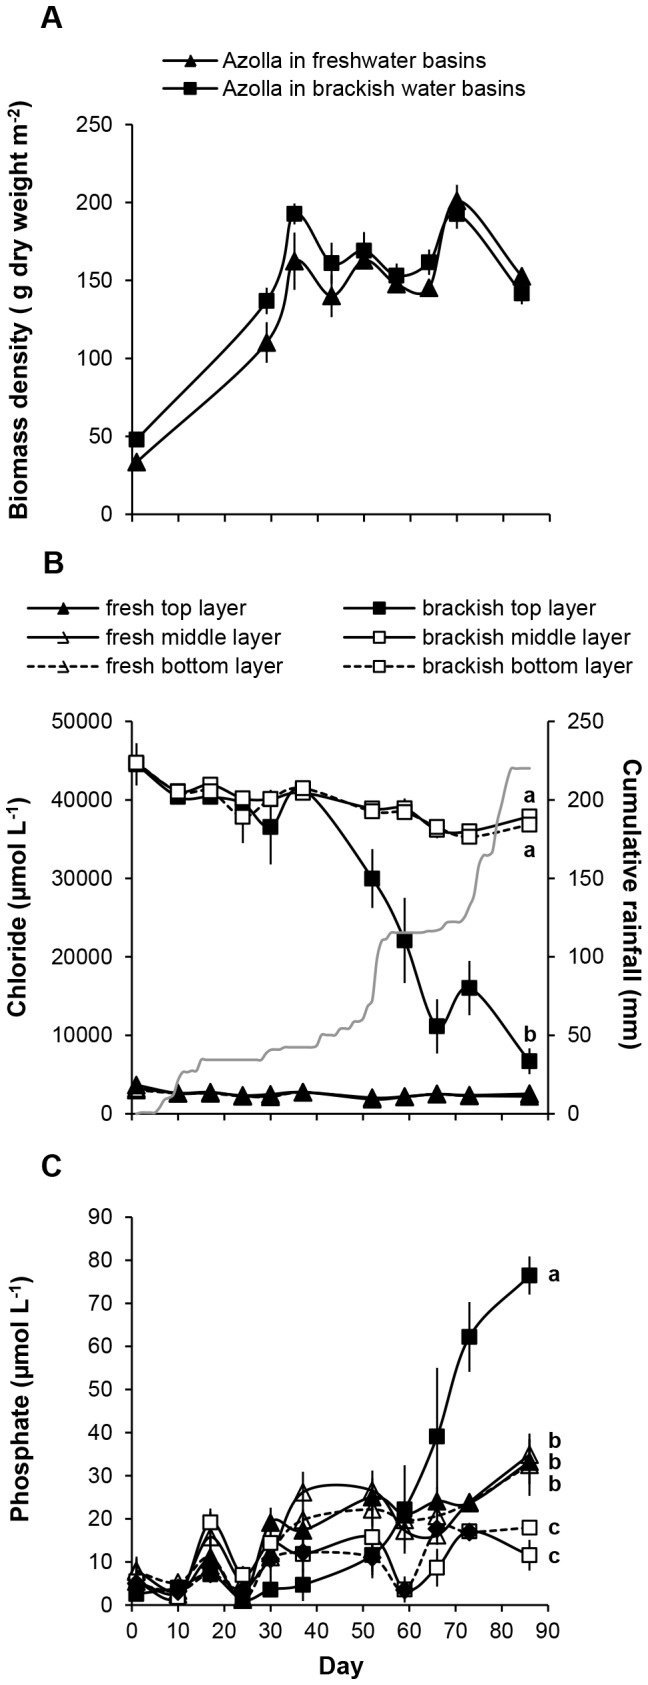
Figure 2. Mesocosm experiment.

A) Development of the biomass density of Azolla filiculoides (g dry weight m−2 ± standard error) grown in freshwater or brackish water basins. 2B) Chloride concentrations and 2C) phosphate concentrations (µM ± standard error) in the top, middle and bottom water layers of the freshwater and brackish water basins during the mesocosm experiment. Significant differences between water layers are indicated by different letters. The cumulative amount of rainfall during the experiment (mm) is shown on the right axis in figure 2B .
