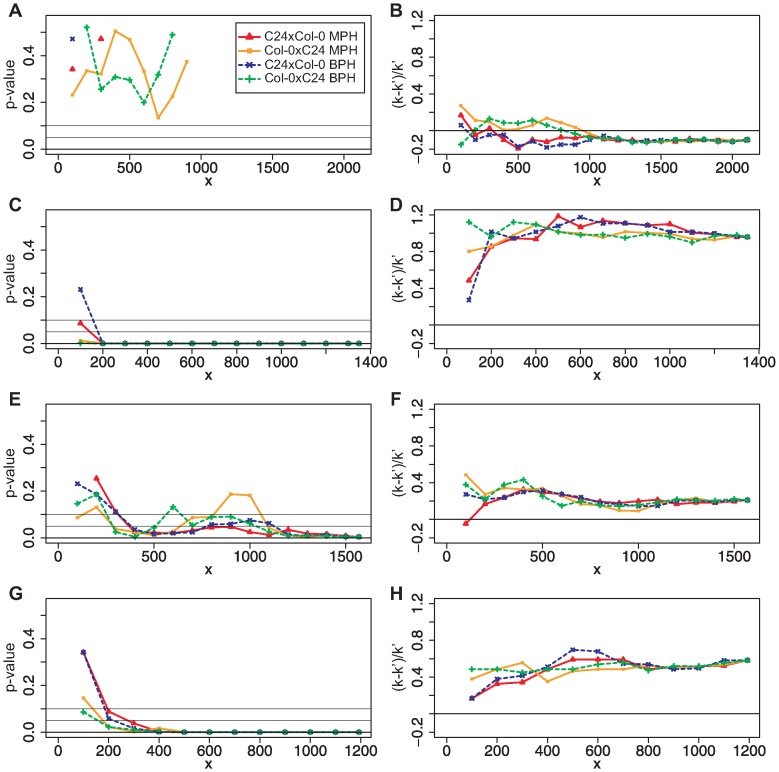
Figure 4. ORA for gene sets containing genes of only one of the five Arabidopsis thaliana chromosomes.
 : number genes in gene set. (A)+(B): chromosome 1; (C)+(D): chromosome 2; (E)+(F): chromosome 3; (G)+(H): chromosome 4; for chromosome 5 no over-representation at all was observed and, therefore, no plots are shown. The probabilities of having as many or more genes in the overlap of random test sets to the gene set than observed for the experimental data are shown on the left side. The proportion of genes that were more in the overlap than expected by chance are shown on the right side. Genes on chromosomes 2 and 4 show a significant over-representation between the results of the two different approaches towards biomass heterosis in early development.

