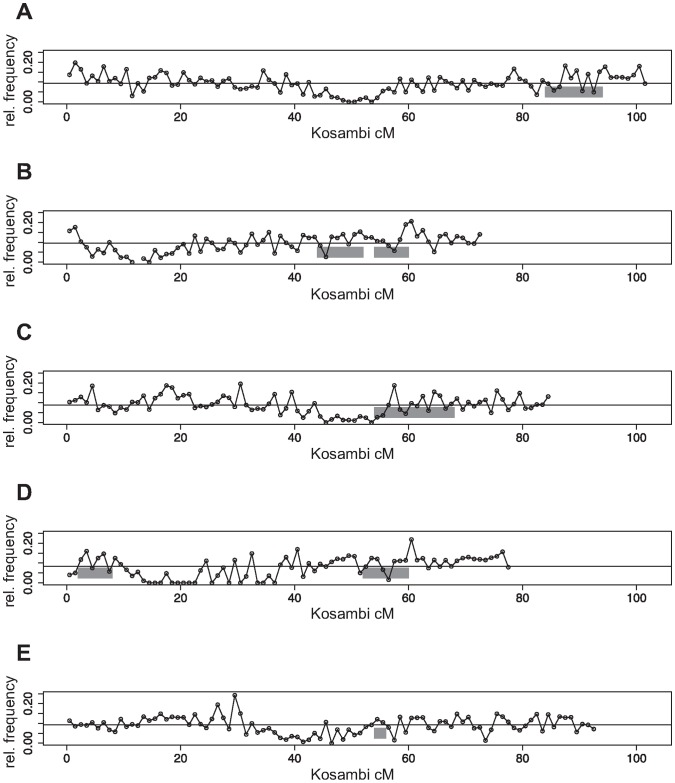
Figure 5. Relative frequencies of top ranked genes according to systems biological approach vs. Kosambi cM.
Relative frequencies (fraction between the number of detected 3000 top ranked genes of C24×Col-0 MPH of the systems biological analysis and all known genes in Arabidopsis thaliana at a specific section on each chromosome) are plotted against the genetic distance (Kosambi cM). (A–E): chromosome 1–5. The gray boxes are the QTL candidate genomic regions contributing to biomass heterosis [5]. The horizontal lines are the median values of the relative frequencies per chromosome. For chromosomes 2 and 4 the relative frequency exceeds the median relative frequency especially in the area of the detected QTL. This is in line with the detected significant over-representation on these chromosomes of the genes detected in the systems biology approach in the genes from the QTL study.

