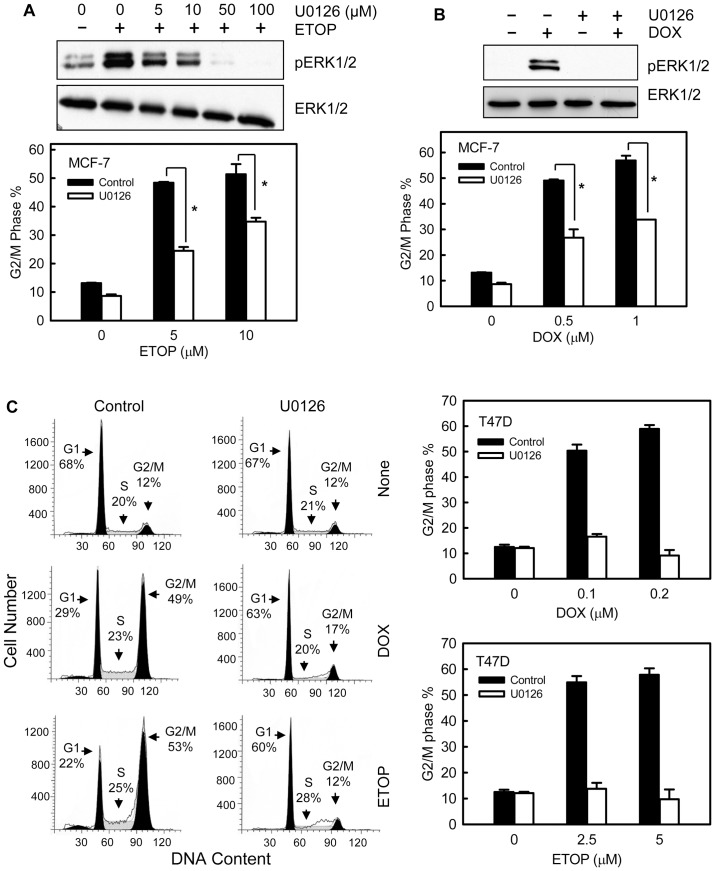
Figure 3. Inhibition of ERK1/2 attenuates topo II poison-induced G2/M arrest in MCF-7 cells.
(A) Upper panel: MCF-7 cells were incubated with U0126 at the indicated doses for 1 hr and then treated with 10 µM ETOP for 2 hr with the presence of U0126. The cells were lysed and analyzed for phospho- and total-ERK1/2. Lower panel: in the presence or absence of 50 µM U0126, MCF-7 cells were treated with ETOP at the indicated doses for 2 hr. The cells were washed, incubated for additional 24 hr in the presence or absence of U0126, and analyzed for DNA content by FACS. Bar graphs depict the percentage of cells with 4N-DNA content (G2/M phase cells) and represent the average of two independent experiments in duplicate. *p<0.001 (n = 4). (B) Upper panel: in the presence or absence of 50 µM U0126, cells were treated with/without 0.5 µM DOX for 2 hr and analyzed for phospho- and total-ERK1/2. Lower panel: MCF-7 cells were treated with DOX at the indicated doses for 2 hr, in the presence or absence of 50 µM U0126. The cells were washed, incubated for additional 24 hr with/without U0126 and analyzed for DNA content. Bar graphs depict the percentage of cells with 4N-DNA content and represent the average of two independent experiments in duplicate. *p<0.001 (n = 4). (C) Left panel: T47D cells were treated with/without 0.1 µM DOX or 5 µM ETOP in the presence or absence of U0126 and incubated for 24 hr. Histograms shown are FACS analyses of the resulting cells. Cell cycle phases are indicated. Right panels: Cells were treated with DOX (upper panel) or ETOP (lower panel) at the indicated doses in the presence or absence of U0126. After 24 hr incubation, the cells were analyzed for DNA content. Bar graphs depict the percentage of G2/M phase cells and represent the average of two independent experiments in duplicate.

