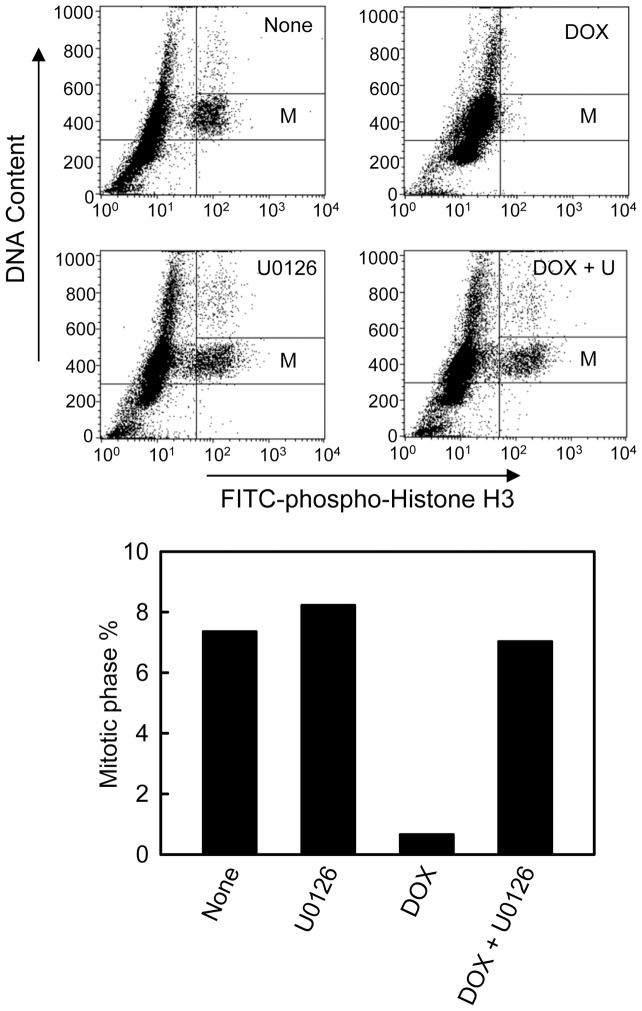
Figure 5. ERK1/2 inhibition abrogates IR-induced G2/M checkpoint activation.
MCF-7 cells were treated with or without 1 μM DOX in the presence or absence of 50 μM U0126 for 2 hr and washed. The cells were incubated in regular growth medium for additional 22 hr, in the presence of 100 ng/ml nocodazole, and analyzed for mitotic cells by FACS, which contain both 4N-DNA content and Histone H3-Ser10 phosphorylation, as described in Materials and Methods. Upper panel: the histograms shown are representative FACS analyses for mitotic cells in samples treated with/without DOX in the presence or absence of U0126. The location of mitotic cells in each sample is indicated (M). Lower panel: the bar graph compares percentage of mitotic cells presented in the indicated cell samples. Results shown are representative of two separate experiments.

