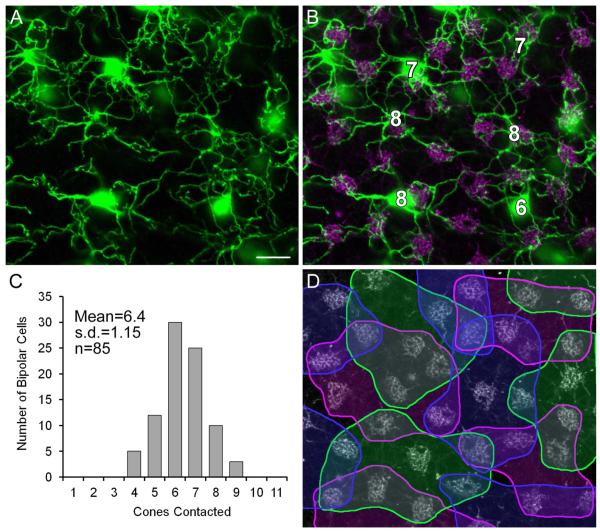
Figure 6.
Cone contacts of DB1 bipolar cells. A: Projection of horizontal sections of retina (3 × 0.6 μm) showing dendritic trees of neighboring DB1 cells in mid-peripheral retina. B: Same field as in A, cone pedicles are labeled with GluK1. DB1 cells were in contact with 6–8 cones. C: Frequency histogram of the number of cone contacts of individual DB1 cells. D: Same field as in A with colored outlines defining the cone pedicles contacted by each DB1 cell. Note that several cone pedicles are contacted by 2–3 DB1 cells and one cone pedicle is contacted by four DB1 cells. Scale bar = 10 μm. [Color figure can be viewed in the online issue, which is available at wileyonlinelibrary.com.]

