
Figure 2.
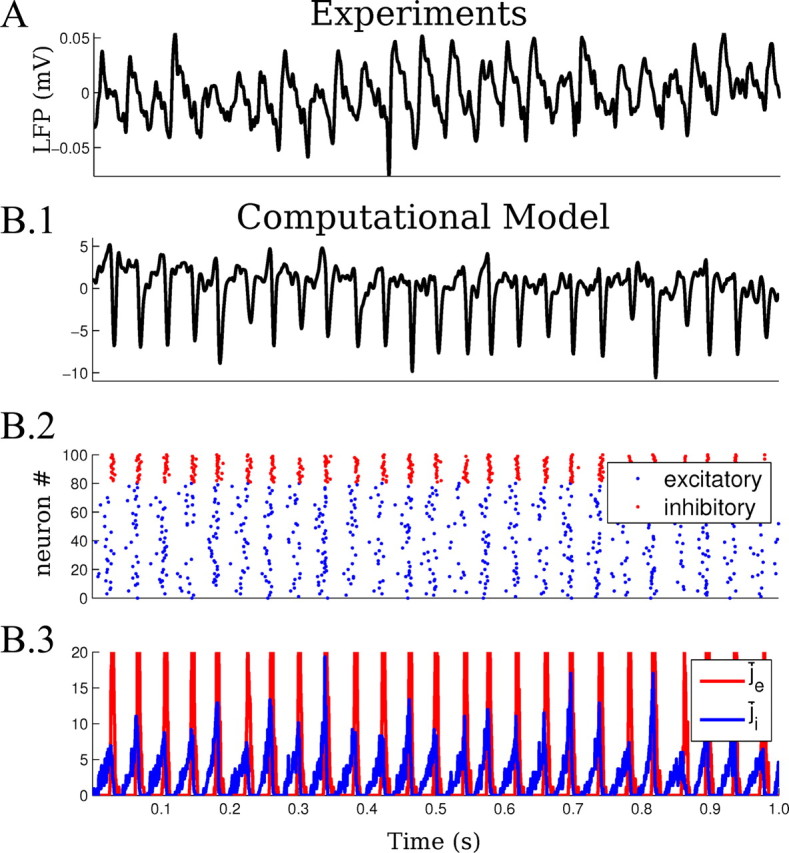
Gamma oscillations generated by carbachol application in vitro and in the computational network model. A, The 20 μM carbachol induces beta–gamma oscillations in rat brain slices, measurable as oscillatory activity of the LFP (25–35 Hz, low passed at 100 Hz). The activity is stable in power and frequency. B.1, Simulated LFP in the computational network model (low passed at 100 Hz). The LFP in the model is the average of the postsynaptic currents across the network. B.2, Raster plot representing the firing activity of excitatory (blue) and inhibitory (red) neurons during induced oscillations in the computational network model (sample of 80 excitatory and 20 inhibitory shown). B.3, Average excitatory and inhibitory currents (j̄e and j̄i) during the simulated oscillations.