
Figure 3.
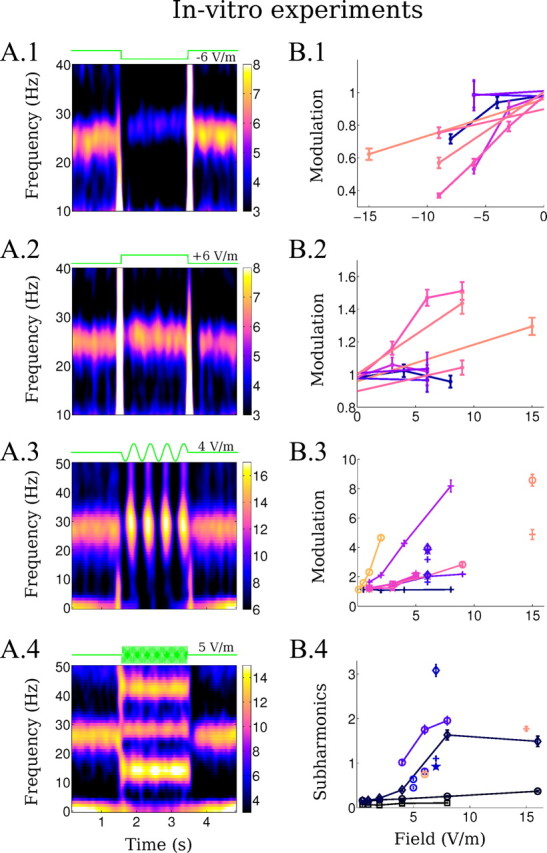
Changes in LFP oscillation during application of weak uniform fields in vitro. A, Left column, Mean spectrograms of the LFP (in dB) during the application of the uniform field with different waveforms (fields applied between 1.5 and 3.5 s). A.1, Negative DC stimulation (−6 V/m). A.2, Positive DC stimulation (+6 V/m). A.3, Low-frequency AC stimulation (2 Hz, 4 V/m). A.4, Higher frequency AC stimulation (28 Hz, 5 V/m). B, Right column, Summarizes the modulation of oscillatory power across slices. B.1, B.2, Modulation is measured relative to baseline during negative (B.1) and positive (B.2) DC stimulation. B.3, Modulation of power during low-frequency AC stimulation is measured as a ratio between enhancing and suppressing cycles (+, 2 Hz; ★, Hz; ∘, 7 Hz; □, 10 Hz; ◊, 12 Hz). B.4, Subharmonics power is measured at half the stimulation frequency relative to baseline power at the endogenous frequency (★, 20 Hz; +, 26 Hz; ∘, 28 Hz; □, 30 Hz; ◊, 40 Hz). Data from the same slice is indicated by color. Error bars indicated standard error of the mean.