Figure 5.
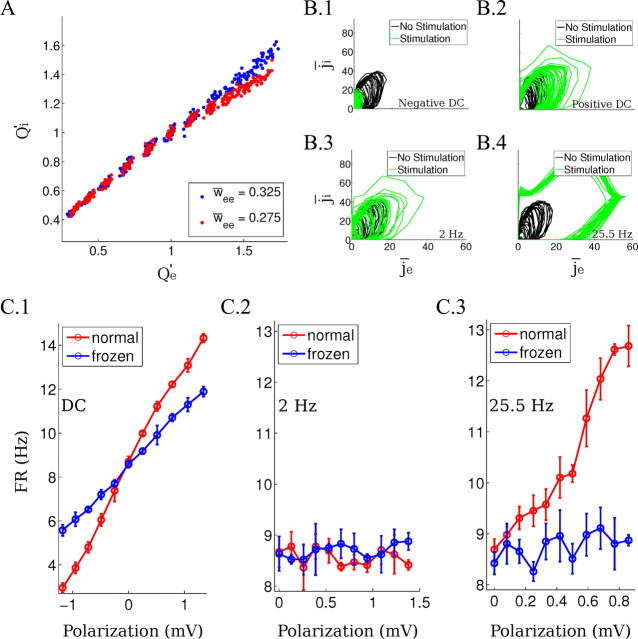
Analysis of the computational model results. A, Integrated synaptic drive Qe′ and Qi′ (total charge delivered relative to baseline) during DC stimulation at various field intensities. Each point indicates data from repeated runs of the model averaged >30 frames (blue for w̄ee = 0.325 and red for w̄ee = 0.275). Clusters reflect results for 11 field intensities tested indicating that the network converges to the same stable balance point. B, The instantaneous synaptic network drive in the computational model is represented as a point in the (j̄i, j̄e) space. The trajectory of the points represents the instantaneous level of excitation/inhibition (following a 5 point moving average) before (black line) and during field application (green line). The stimulation amplitudes applied are the same as in the spectrograms in Figure 4A and in the raster plots in Figure 6A. B.1, B.2, Hyperpolarizing and depolarizing DC stimulation; B.3, 2 Hz stimulation; B.4, 25.5 Hz stimulation. C, Frozen-input condition for different waveforms applied in the computational model. Firing rate change during the application of the field under normal conditions (red line) and frozen-input conditions (blue line) as a function of the average single-neuron polarization ΔV. C.1, DC stimulation. C.2, 2 Hz AC stimulation. C.3, 25.5 Hz AC stimulation. Error bars indicate SD.

