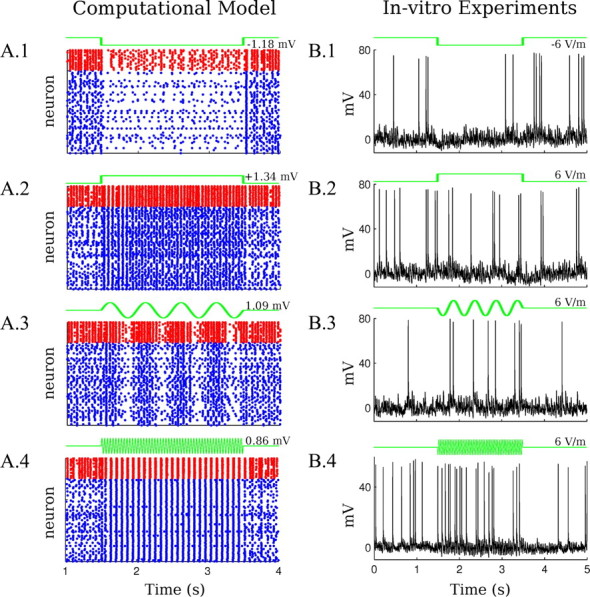
Figure 6.

Model predictions for spiking activity and validation with intracellular recordings. A, Raster plots on the left column indicate spiking activity for a sample of model neurons during electrical stimulation (blue for excitatory and red for inhibitory). The frequencies and amplitudes of the applied fields are the same as in Figure 4A. A.1, Negative DC stimulation. A.2, Positive DC stimulation. A.3, Low-frequency AC stimulation (2 Hz). A.4, Higher frequency AC stimulation (25.5 Hz). B, Right column, Illustrative intracellular recordings in slices during electrical stimulation (6 V/m). B.1, Negative DC stimulation. B.2, Positive DC stimulation. B.3, Low-frequency AC stimulation (2 Hz). A.4: Higher frequency AC stimulation (26 Hz). Quantitative comparison between the model and the intracellular recordings requires aggregating data over multiple frames (see Fig. 7).
