
Figure 7.
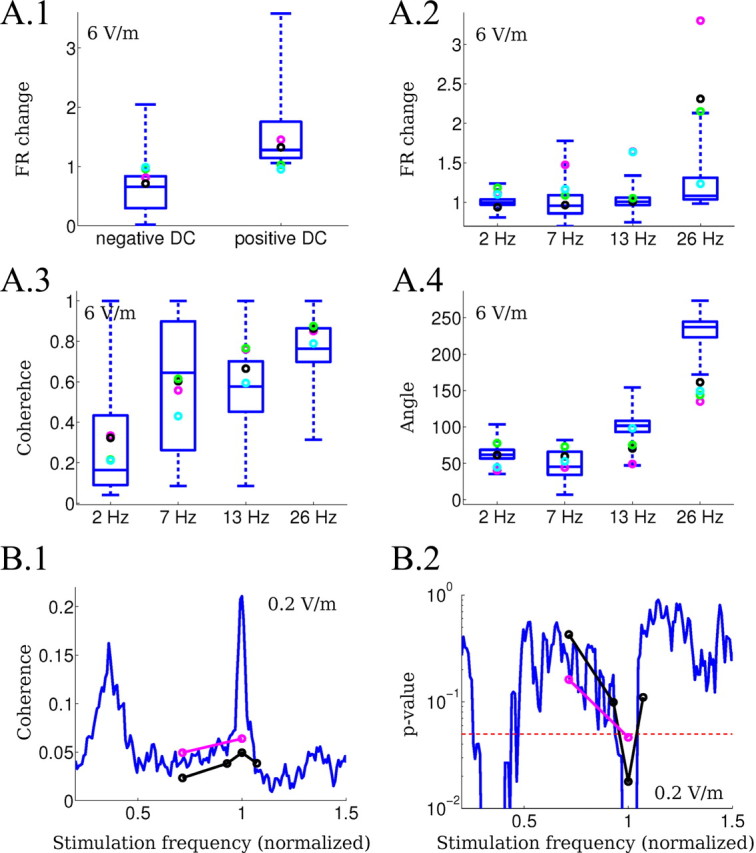
Quantitative comparison of the intracellular recordings with the computational model predictions. A, The experimental data (circles) are compared with the results of the model (blue box indicating median and 75th percentile, outliers not plotted). DC and 2, 7, 13, and 26 Hz were tested using 6 V/m fields corresponding in the computational model to ΔV = 0.5 mV for the DC case. A.1, Firing rate change (relative to baseline) during the application of positive and negative DC stimulation. A.2, Firing rate change (relative to baseline) during the application of AC stimulation. A.3, Coherence between the spikes and the applied AC fields. A.4, Mean angle between the spikes and the applied AC fields. B, Phase-entrainment resonance induced for very low-amplitude fields (0.2 V/m) in the experiments (circles) and the model (solid blue line). B.1, Coherence measured as vector strength of the phase of spike time relative to the applied oscillating field. Frequencies of the applied field are normalized to the endogenous frequency to facilitate comparison. B.2, The p-value for coherence measures (p = 0.05, dotted line).