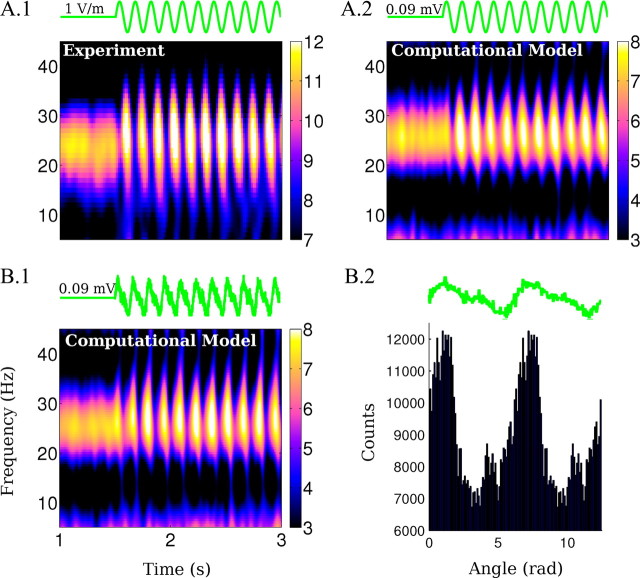
Figure 9.
Modulation of gamma power when applying a waveform approximating endogenous hippocampal theta oscillations. A.1, B.1, Spectrograms (in dB) of the effects of 7 Hz, 1 V/m AC fields on the oscillations in the experiments and the model (IE = kEE = 0.067). B.1, Spectrogram of the LFP (in dB) during the application of a theta field in the model. B.2, Phase distribution of spikes relative to the field applied as in B.1 for all excitatory neurons in the simulated network.

