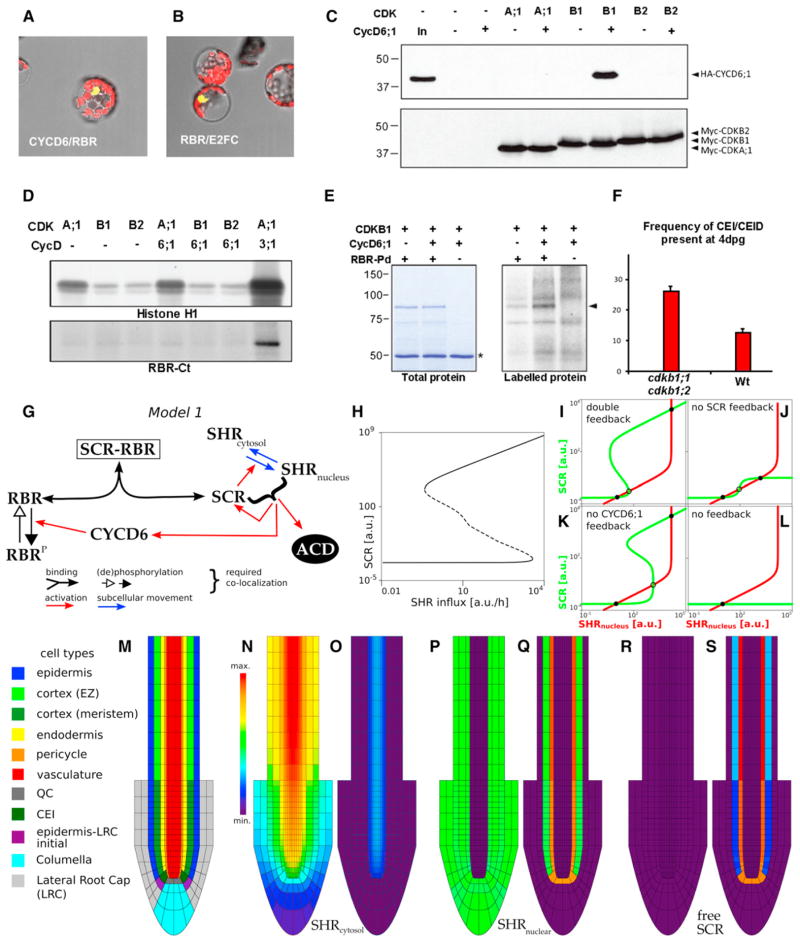
Figure 3. Specific Interaction between CDKB1 and CYCD6;1 Forms a Protein Complex that Phosphorylates RBR.
(A and B) BiFC assays for in vivo interaction between CYCD6 and RBR (A) with E2FC/RBR as positive control (B).
(C) Myc-CDK and HA-CYCD6;1 proteins expressed in Arabidopsis protoplasts. Protein gel blots of complexes immunoprecipitated with anti-c-Myc antibodies using anti-HA and anti-c-Myc antibodies to detect CYCD6;1 binding and CDK expression, respectively.
(D) Myc-CDK expressed in Arabidopsis protoplasts either alone or together with HA-CYCD6;1 or HA-CYCD3;1 and precipitated with anti-c-Myc antibody. Kinase activity of immunocomplexes in the presence of [γ-32P]ATP using histone H1 and GST-RBR-Ct proteins as substrates and detected by autoradiography of protein gels.
(E) Kinase activity of CDKB1 and CDKB1-CYCD6;1 expressed in protoplasts in the presence of [γ-32P]ATP using GST-RBR pocket domain (GST-RBR-Pd) as substrate, detected by autoradiography. Asterisk marks IgG heavy chain.
(F) Frequency of undivided CEI and CEIDs in roots of WT and ckdb1;1 cdkb1;2 seedlings 4 dpg. Differences are significant (t test < 0.05); error bars indicate SEM.
(G) Schematic of model 1.
(H) Bifurcation diagram with equilibrium levels of free SCR as a function of SHR influx into the cell. Dashed line indicates unstable equilibria. Both a high and a low stable SCR level exist over a wide range of influx.
(I–L) Phase plane analysis of model 1 using quasi-steady-state assumptions (see Figure S2). (I) Model 1 presents two stable equilibria (solid black circles, one of high SCR and nuclear SHR levels and the other of low SCR and nuclear SHR levels) separated by an unstable equilibrium (open circle). (J and K) When the activation mediated by CYCD6;1 or the feedback of SCR and nuclear SHR on SCR transcription is turned off, the model continues presenting bistability.
(L) Without either of these feedbacks, no bistability occurs for any parameter setting.
(M) Root layout for all spatial simulations.
(N–S) Cytosolic SHR (N and O), nuclear SHR (P and Q), and free SCR (R and S) for weak (N, P, and R) and strong (O, Q, and S) activation mediated by CYCD6;1 (see “Modeling Procedures,” Figure S2, and Tables S1 and S2). Molecular weight standards are indicated in kilodaltons.

