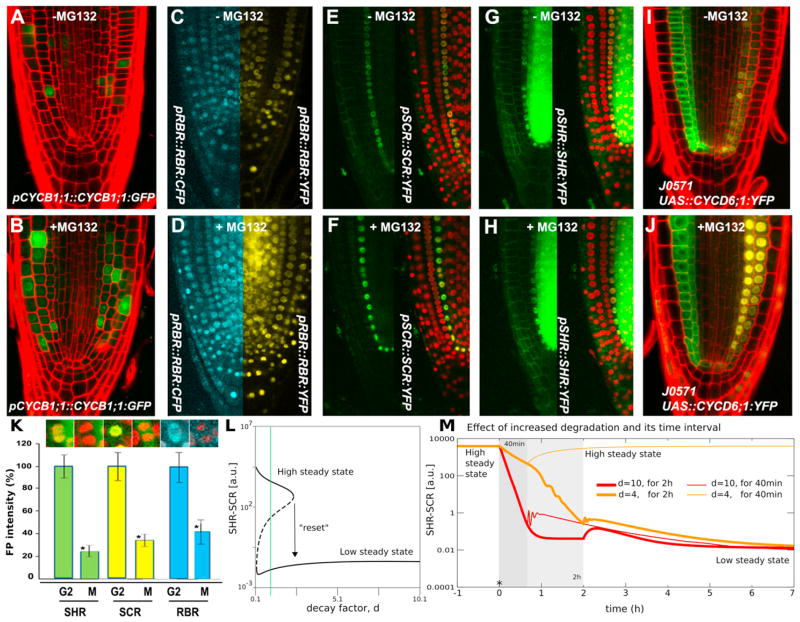
Figure 6. Protein Degradation Turns “Off” the Switch.
(A–K) Expression patterns prior to and after MG132 treatment for pCYCB1;1:: CYCB1;1:GFP (A and B), pRBR::RBR:CFP/pRBR::RBR:YFP (C and D), pSCR::SCR:YFP/p35S::H2B:RFP (E and F), pSHR::SHR:YFP/p35S::H2B:RFP (G and H), and J0571/pUAS::CYCD6;1:YFP (I and J). Quantification of total fluorescence intensity before and after mitosis for pSHR::SHR:YFP/p35S::H2B:RFP, pSCR::SCR:YFP/p35S::H2B:RFP, and pRBR::RBR:CFP/p35S::H2B:RFP plants (K); Student’s t test was used to assess the statistical significance of the distributions (*p < 0.05). Arrow bar represents SEM.
(L) Bifurcation diagram showing equilibrium SHR-SCR levels as a function of the level of enhanced protein degradation, d.
(M) Time dynamics for intermediate (40 min, thin lines) and long (2 hr, thick lines) time span of enhanced protein degradation. Red, d = 10; orange, d = 4. See also Figure S5.

