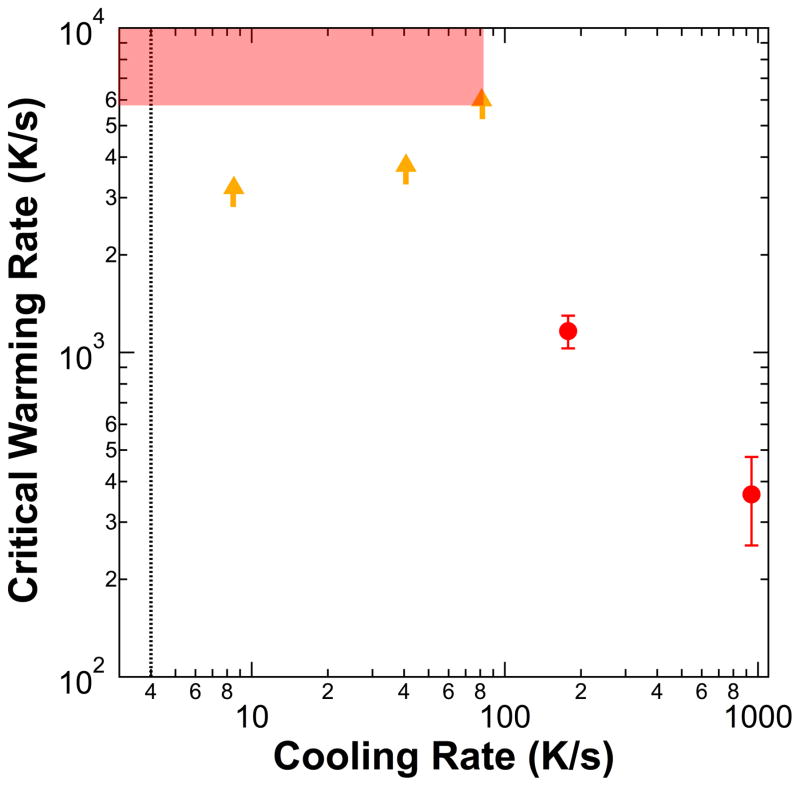
Figure 4.
Measured critical warming rate versus sample cooling rate for 44% w/w ethylene glycol solutions. Red circles indicate measured critical warming rates. Orange arrows indicate measured lower limits for the critical warming rate when the rate was too fast to measure; the actual warming rates must lie in or above the red shaded region. The dashed line indicates the measured critical cooling rate [4,6,13,58].

