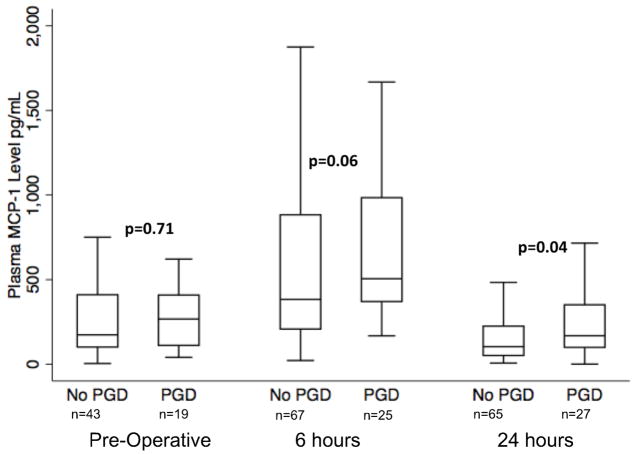
Figure 2.
Plasma MCP-1 concentration in subjects without grade 3 PGD within 72 hours and with grade 3 PGD within 72 hours at each timepoint. P-values reported are for Wilcoxon rank sum test at each time point. Horizontal line indicates median concentration. The upper and lower limits of the box indicate the inter-quartile range.

