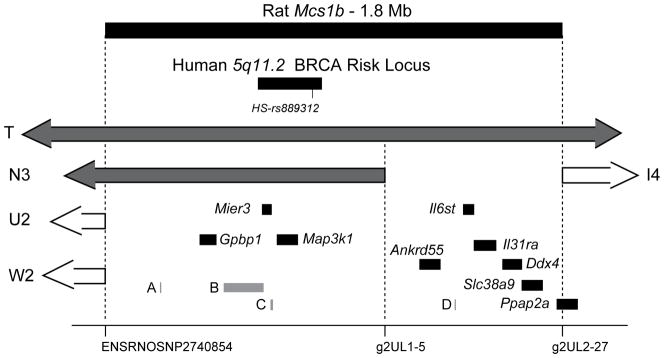
Figure 3. Rat Mcs1b contains the ortholog of GWAS identified human 5q11.2 breast cancer risk allele marked by SNP rs889312 and multiple human/rat conserved transcripts.
Genetic markers used to map Mcs1b to this region are marked on the x-axis. Ends of relevant congenic lines are included for orientation. Potential candidate breast cancer susceptibility gene transcripts mapping to rat Mcs1b are shown as filled black bars that represent exonic and intronic DNA. Gene names are flanking 5′-UTRs of respective transcripts. Elements shown as gray bars and designated as A, B, C, or D correspond to predicted Actbl2, ENSRNOG00000013098, C5orf35, and ENSRNOG00000034909, respectively.

