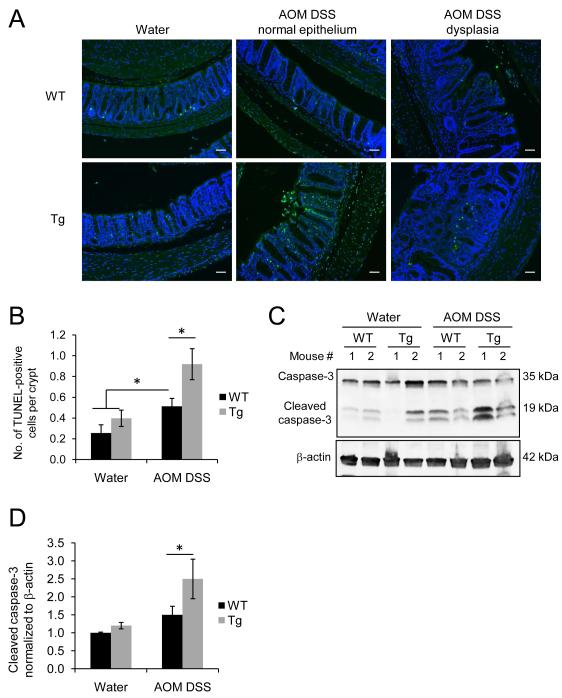
Figure 2. IEC-specific PHB overexpression is associated with increased apoptosis during CAC.
(A) Fluorescent micrograph of TUNEL staining (green) of colonic sections from untreated (water) and AOM-DSS treated WT and PHB Tg mice. Sections were stained with DAPI to visualize nuclei (blue). Scale bars = 100 μm. (B) Number of TUNEL-positive cells per crypt in normal epithelium. *P < 0.05. n = 3 for water; n = 9 for AOM DSS. (C) Representative Western blots showing colonic mucosal cleaved caspase-3 levels and β-actin as a loading control. (D) Cumulative mean ± SEM relative to WT water. *P < 0.05. vs. WT AOM DSS. n ≥ 5 per treatment.

