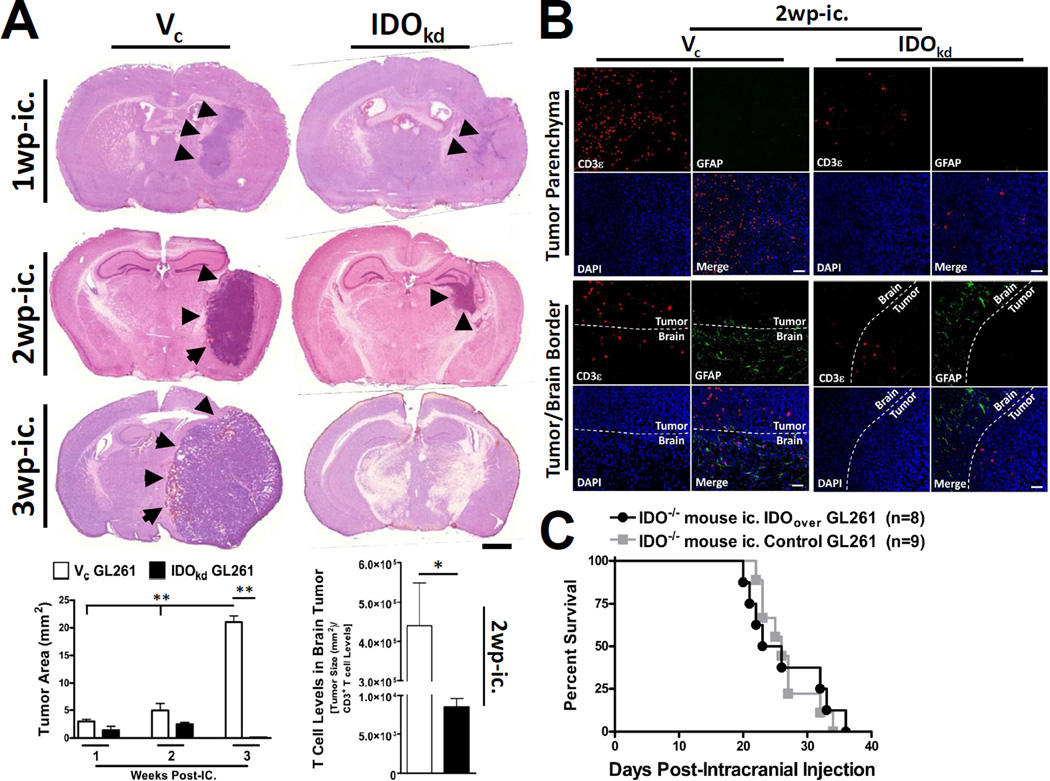
Figure 5. The expression of IDO in brain tumors is associated with increased T cell infiltration.
(A) Indoleamine 2,3 dioxygenase 1-deficient (IDO−/−) mice were intracranially-injected (ic.) 4×10⁵ GL261 cells transduced with -scrambled shRNA (vector control, Vc; white bars) or -shRNA specific to IDO (IDO knockdown, IDOkd; black bars). Mice were euthanized at 1, 2 or 3 weeks post-intracranial injection (wp-ic.), brains were flash frozen and systematically sectioned throughout the tumor injection site. Brain sections were stained with hematoxylin and eosin and scanned by the CRi Pannoramic Whole Slide Scanner. In each section, tumors (black arrows) were traced using the Pannoramic Viewer software and the area was digitally calculated. Scale bar = 1mm. Bar graphs representing the Vc (white bars) and IDOkd (black bars) median tumor volume are represented for the 1, 2 and 3 wp-ic. time points. The 2 wp-ic. tumor volumes were then divided by the absolute amount of CD3+ T cells based on flow cytometric quantification. Bar graphs are shown as mean±SEM (n=4 mice/group). (B) Fluorescent microscopy for CD3 and glial fibrillary acidic protein (GFAP) expression, as well as nuclear DAPI staining, was performed in IDO−/− mice ic. Vc and IDOkd GL261 cells at 2 wp-ic. Photomicrographs of the deep tumor parenchyma (top panel) or at the tumor/brain border (bottom panel) were imaged at 20× magnification. Bars, 50 μm. (C) IDO−/− mice were intracranially-injected (ic.) 4×10⁵ GL261 cells transfected the pEF6 vector alone (control) or the pEF6 vector with an inserted IDO cassette (IDO-overexpressing, IDOover). *p < 0.05; **p < 0.01.

