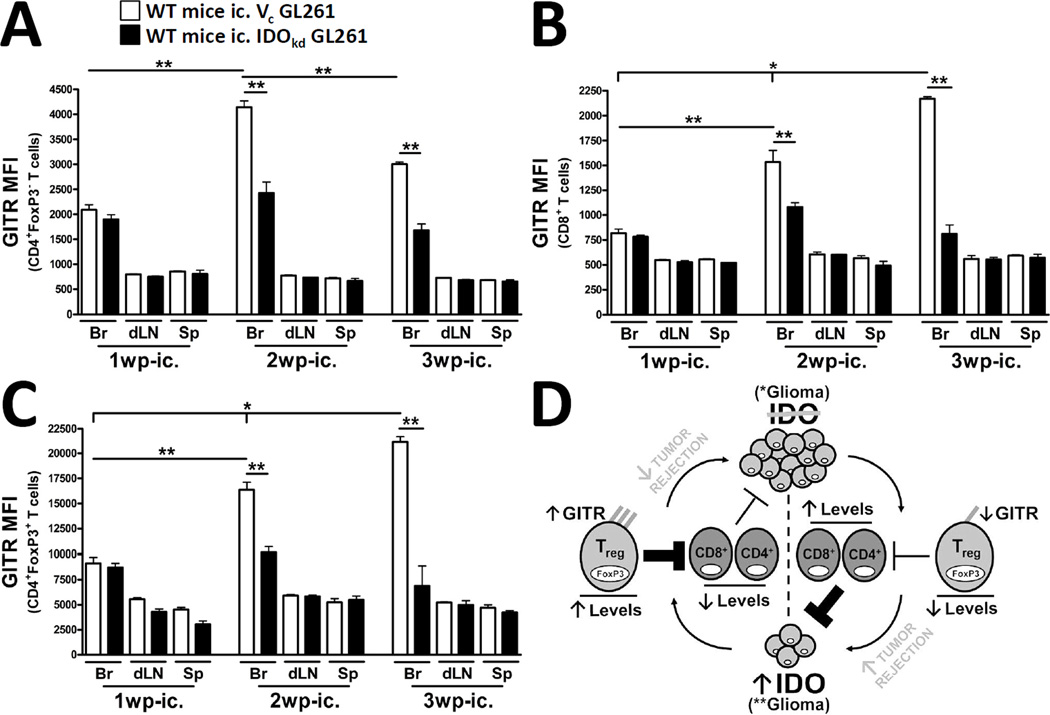
Figure 6. Brain tumor-expressed IDO upregulates GITR levels on tumor-infiltrating T cells.
Wild-type (WT) mice were intracranially-injected (ic.) 4×10⁵ GL261 cells transduced with -scrambled shRNA (vector control, Vc; white bars) or -shRNA specific to IDO (IDO knockdown, IDOkd; black bars). The mean fluorescence intensity of GITR expressed by (A) CD4+FoxP3− T cells, (B) CD8+ T cells and (C) CD4+FoxP3+ regulatory T cells isolated from the brains, ipsilateral cervical draining lymph nodes (dLN) and spleen of tumor-bearing mice were analyzed at 1, 2 and 3 weeks post-injection. All T cell populations were initially identified by the expression of CD3. Bar graphs in figures A – C are shown as mean ± SEM and are representative of two independent experiments (n = 5 mice/group). (D) When IDO is absent from brain tumors, GITR expression remains low on infiltrating T cells. Moreover, while Treg levels remain decreased, CD4+ non-Tregs and CD8+ cytotoxic T cells are increased, resulting in effective tumor rejection. Reciprocally, when IDO is expressed, GITR expression is upregulated on infiltrating T cells; this is particularly evident on Tregs. This is co-incident with a significant increase in the ratio of Tregs, when compared to CD4+ non-Tregs and CD8+ cytotoxic T cells. The increased fraction of immunosuppressive Tregs is then associated with decreased tumor rejection and increased outgrowth. *p < 0.05; **p < 0.01.

