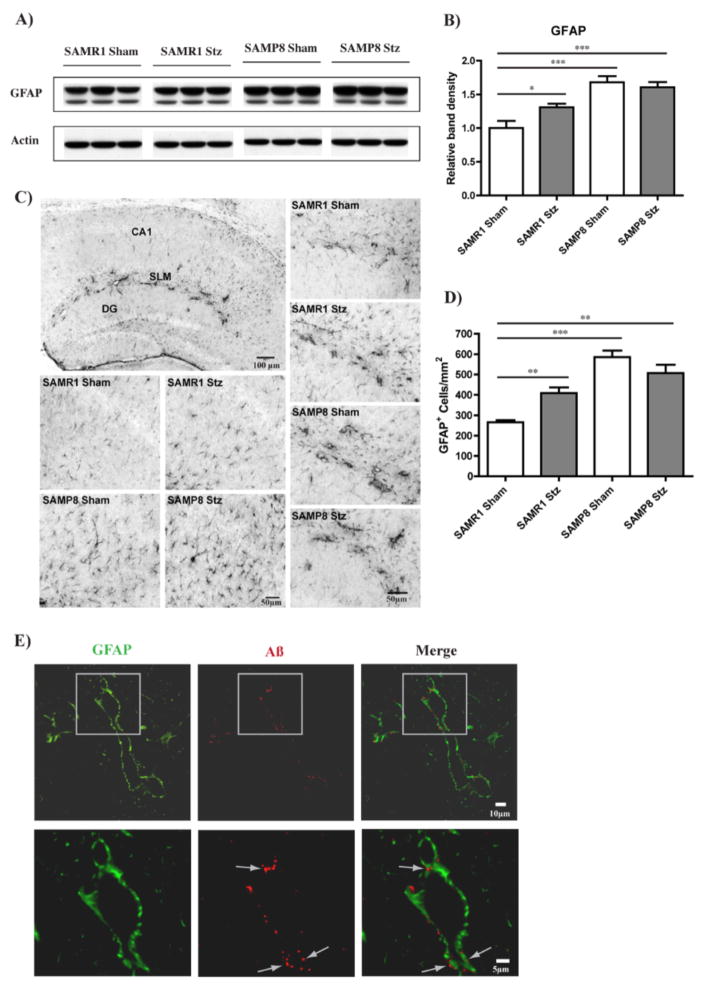
Figure 5. Astrocytosis in the hippocampus of T1D mice.
(A) WB analysis of GFAP in the RIPA-soluble fraction of hippocampal tissue. (B) Increased GFAP levels (relative to actin) were identified in SAMP8 mice as compared with SAMR1 control mice. T1D also elevated GFAP levels in SAMR1 mice but did not further increase them in SAMP8 mice. *p<0.05, ***p<0.001, One-way ANOVA followed by Newman-Keuls post-hoc test (n = 4–5/group). (C) IHC analysis of GFAP in the hippocampus confirmed increased numbers of GFAP-positive astrocytes in SAMP8 mice and T1D SAMR1 mice, as quantified in (D), accompanied by morphological changes towards more ramified shapes as can be seen in (C). Increased GFAP expression was particularly noticeable at the SLM, appearing to be associated with blood vessels ((C), first panel, SAMP8 T1D, and right panels). **p<0.01, ***p<0.001, One-way ANOVA followed by Newman-Keuls post-hoc test (n = 3/group). Original magnification: x100. All data are mean ± SEM. (E) IHC confocal microscopy analysis shows that the Aβ aggregation (arrows) detected in the SLM of the hippocampus of T1D SAMP8 mice (also verified in the other groups where Aβ aggregation was elevated) was consistently associated with GFAP-positive cells indicating the presence of Aβ within astrocytes. Original magnification: x630.

