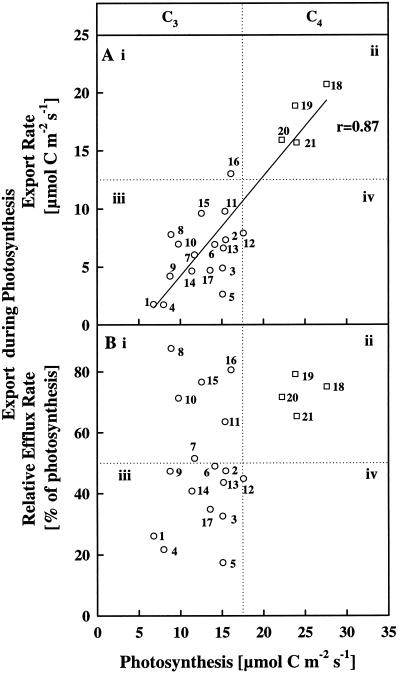
Figure 3.
Net photosynthesis of leaves of 21 species plotted against their concurrent export rates, expressed as absolute values (A) and as relative C-efflux rate calculated as a percentage of the net CO2-influx rate (B). A and B were each divided into four quadrants labeled i, ii, iii, and iv, so that the data could be compared easily with those in Figure 4. The exact intersection point of the vertical and horizontal lines on the axes (i.e. relative to specific values of photosynthesis and export rates) must be viewed as arbitrary. The division of the graphs into quadrants was strictly for convenience in developing an overview of the relationships among the following species: 1, alstroemeria; 2, barley; 3, oat; 4, sandersonia; 5, wheat; 6, bean; 7, catnip; 8, celery; 9, chrysanthemum; 10, coleus; 11, cucumber; 12, pea; 13, pepper; 14, rose; 15, salvia; 16, sunflower; 17, tobacco; 18, maize; 19, sorghum; 20, pigweed; and 21, gomphrena. The C3 and C4 species are indicated by circular and square symbols, respectively. Photosynthesis and export rates were determined as outlined in Methods using mature leaves of each species exposed to light-saturating conditions, ambient CO2 concentrations (inlet air of 35 Pa CO2), and 25°C (the daytime growth temperature). Each point is an average of at least four leaves on four different plants. The se of the means are not shown for graphical clarity.

