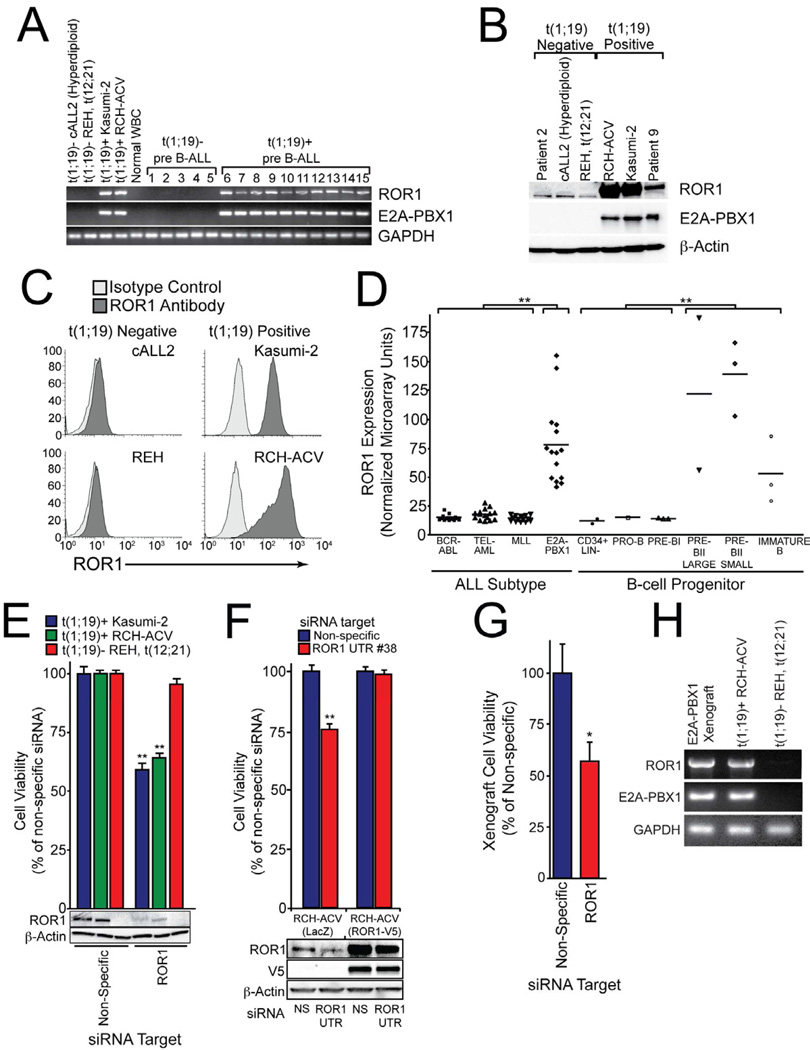
Figure 2. ROR1 is universally expressed and a therapeutic target in t(1;19) ALL.
(A) cDNA derived from t(1;19)-positive and negative cell lines and primary patient samples was amplified using primers specific for ROR1, E2A-PBX1, or GAPDH and PCR products were analyzed by gel electrophoresis.
(B) Whole cell extracts derived from t(1;19)-positive and negative cell lines and primary patient samples were subjected to immunoblot analysis using antibodies specific for ROR1, E2A-PBX1, or β-Actin.
(C) Flow cytometric analysis of t(1;19)-positive and negative cell lines was performed using specific polyclonal anti-human ROR1 antibodies (dark grey histogram) versus isotype control (light grey histogram).
(D) Gene expression microarray data for pediatric ALL patients and normal B-cell progenitor populations were compiled into a meta-analysis. Patients with MLL gene rearrangements, t(9;22) (BCR-ABL), t(12;21) (TEL-AML), or t(1;19) (E2A-PBX1) (n=15 for each subset) and non-malignant B-cell progenitor populations (CD34+ Lin−, pro-B, pre-B, pre-BII large, pre-BII small, and immature B) (n=15 total) were examined and Affymetrix intensity values for ROR1 are plotted for each individual patient sample. (**p <0.01)
(E) RCH-ACV or Kasumi-2 cells (both t(1;19)-positive) as well as REH cells (t(12;21)-positive) were electroporated in the presence of non-specific or ROR1-targeting siRNA and plated into culture media. After 3 days, a sample of cells was harvested for immunoblot analysis using antibodies specific for ROR1 or β-Actin. After 4 days, cells were subjected to an MTS assay to measure cell viability. Values represent percent mean (normalized to non-specific control wells) ± s.e.m. (n = 10). (**p<0.01)
(F) RCH-ACV cells stably expressing ROR1-V5 or LacZ control were electroporated in the presence of non-specific or ROR1 UTR-targeting siRNA and plated into culture media. After 3 days, a sample of cells was harvested for immunoblot analysis using antibodies specific for ROR1, V5, or β-Actin. After 4 days, cells were subjected to an MTS assay to measure cell viability. Values represent percent mean (normalized to non-specific control wells) ± s.e.m. (n = 6). (**p<0.01)
(G) Primary cells from a t(1;19) ALL patient were propagated in NOD-SCID mice lacking the IL-2 receptor γ chain. Xenograft cells were harvested from bone marrow and spleen of overtly leukemic mice and electroporated with non-specific or ROR1-targeting siRNA. After 4 days, cells were subjected to an MTS assay to measure cell viability. Values represent percent mean (normalized to non-specific control wells) ± s.e.m. (n = 4). (*p<0.05)
(H) Primary cells from a t(1;19) ALL patient were propagated in a xenograft mouse model as above and RNA was harvested from cell extracts. PCR was performed on cDNA with primers specific for ROR1, E2A-PBX1, or GAPDH. The t(1;19) positive (RCH-ACV) and negative (REH) cell lines were included for comparison. See also Figure S2.

