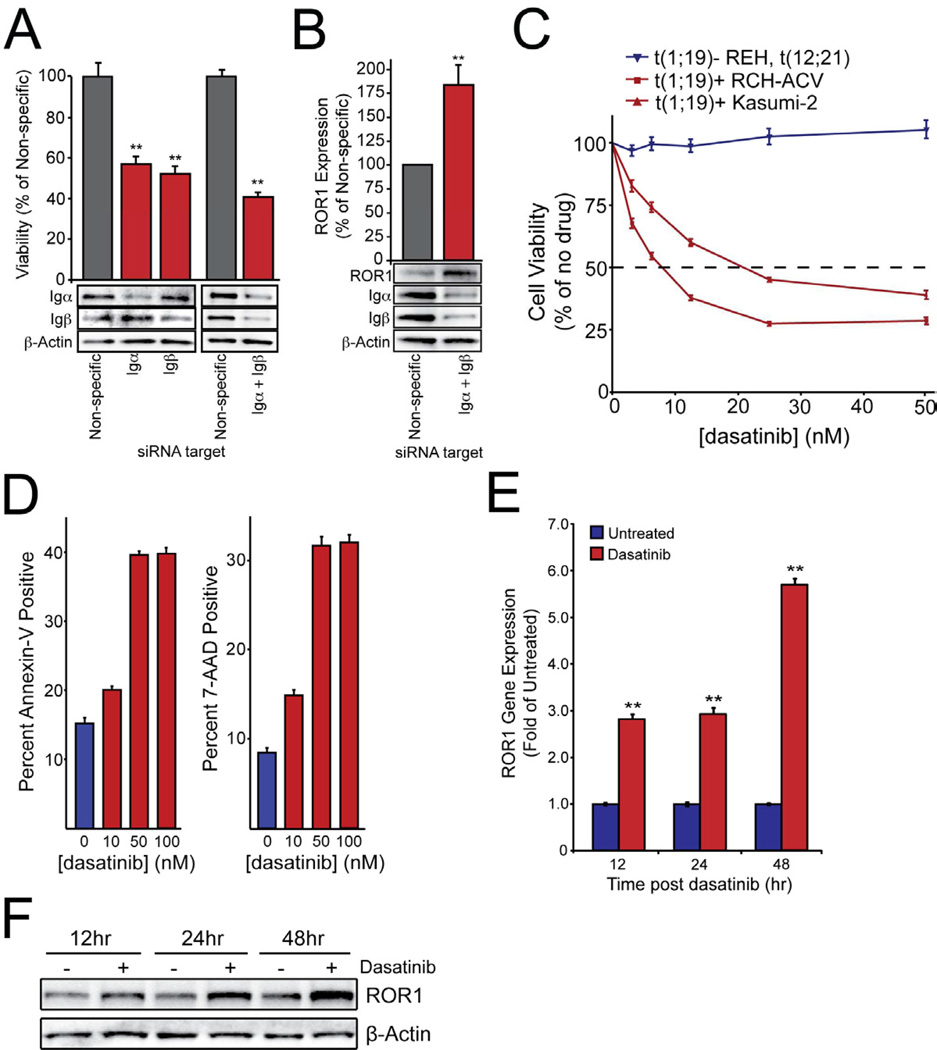
Figure 3. Pre-BCR signaling inhibition impairs t(1;19) cell viability and activates ROR1 expression.
(A) RCH-ACV cells were electroporated in the presence of non-specific siRNA or siRNA targeting Igα, Igβ, or both and then plated in culture media. After 3 days, a sample of cells was harvested for immunoblot analysis using antibodies specific for Igα, Igβ, or β-Actin. After 4 days, cells were subjected to an MTS assay to measure cell viability. Values represent percent mean (normalized to non-specific control wells) ± s.e.m. (n = 6). (**p<.01)
(B) RCH-ACV cells were electroporated in the presence of non-specific or Igα and Igβ-targeting siRNA and then plated in culture media. After 3 days, cells were harvested for immunoblot analysis using antibodies specific for ROR1, Igα, Igβ, or β-Actin. One representative blot is included. Densitometry was performed to quantitate ROR1 expression. Values represent percent mean (normalized to non-specific control) ± s.e.m. (n = 3). (**p<.01)
(C) RCH-ACV, Kasumi-2, and REH cells were cultured in graded concentrations of the kinase inhibitor dasatinib for 3 days at which time cells were subjected to an MTS assay for measurement of cell viability. Values represent percent mean (normalized to no-drug control wells) ± s.e.m. (n = 6).
(D) RCH-ACV cells were cultured in graded concentrations of dasatinib for 96 hours before being stained with Annexin-V PE and 7-AAD and analyzed by flow cytometry to determine induction of apoptosis. Values represent the percentage of total positive cells ± s.e.m. (n = 3). (*p<.05, **p<.01).
(E and F) RCH-ACV cells were cultured in the presence of 100nM dasatinib for 12, 24, and 48 hours. Cells were collected for RNA harvest and quantitative PCR analysis (E) or lysed for immunoblot analysis (F). PCR was performed on cDNA with primers specific for ROR1 and GAPDH to determine relative ROR1 mRNA expression levels. Values represent the fold change (normalized to untreated control cells) ± s.e.m. (n = 6). (**p<.01). Immunoblotting was performed with antibodies specific for ROR1 or β-Actin to determine relative ROR1 protein expression. See also Figure S3.

