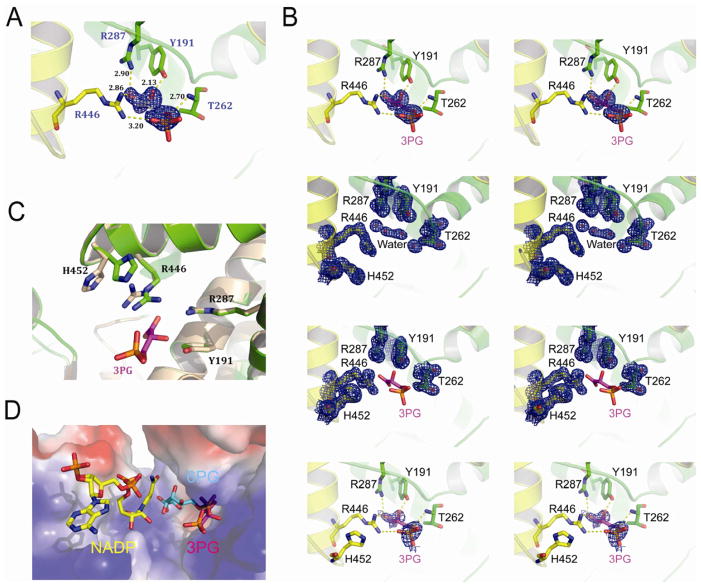
Figure 3. Co-crystallization analysis of 3-PG mediated inhibition of 6PGD.
(A) Stereo view of the Fo-Fc electron density map contoured at 3.0 σ around 3-PG. The Fo-Fc density map is shown as blue mesh. Residues of 6PGD interact with 3-PG are shown in stick.
(B) Upper top: Stereo view of the unbiased Fo-Fc electron density map contoured at 3.0 σ around 3PG. The Fo-Fc density map is shown as blue mesh. Residues interact with 3-PG are shown in stick. Lower top: Stereo view of the 2Fo-Fc electron density map of 6PGD apo-form contoured at 1.2 σ at 3-PG binding pocket in the same orientation as in Figure 2A. The 2Fo-Fc density map is shown as blue mesh. Upper bottom: Stereo view of the 2Fo-Fc electron density map of 6PGD-3-PG complex contoured at 1.2 σ at 3-PG binding pocket in the same orientation as in Figure 3A and 3C. The 2Fo-Fc density map is shown as blue mesh. Lower bottom: Stereo view of simulated-annealing omit map contoured at 0.8 σ around 3-PG. The omit density map is shown as blue mesh.
(C) Structure comparison of the 6PGD apo-form (wheat) and the 6PGD-3-PG complex (green). Arg 446 and His 452 in the 6PGD-3-PG complex structure show different conformation.
(D) Surface electrostatic potential of the substrate-binding pocket of 6PGD. The bound 3-PG (pink) competes with 6-PG (blue) but not NADP (yellow) in the active site. The model was built by aligning structures of 6PGD-NADP (PDB code: 2JKV), 6PGD-6-PG (PDB code: 3FWN) and 6PGD-3PG.
See also Table S4.

