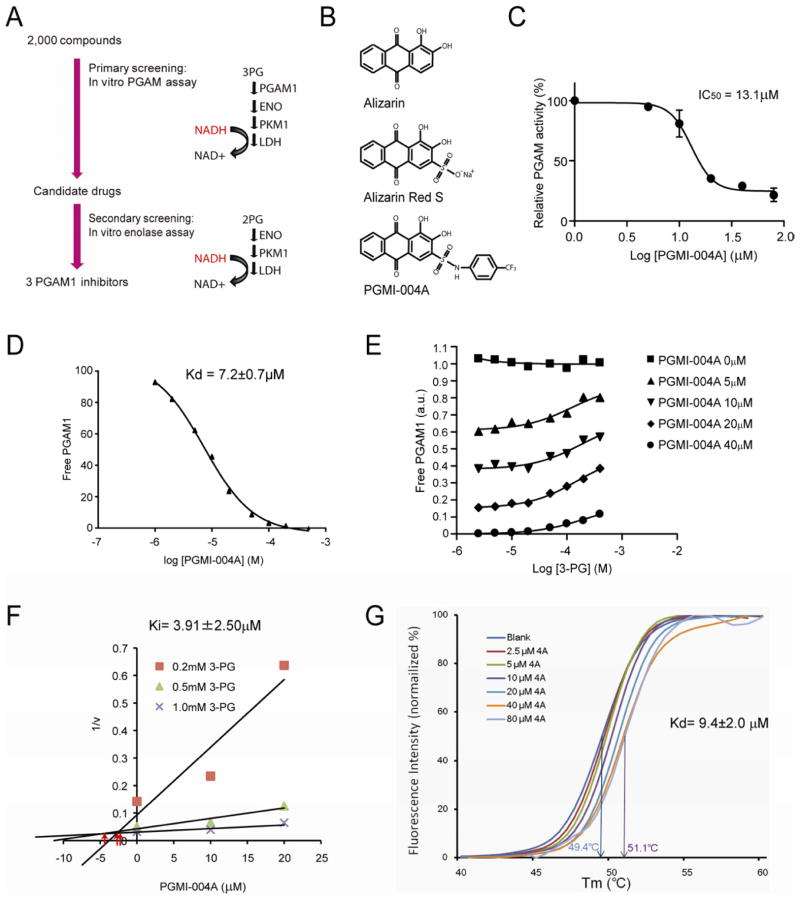
Figure 6. Identification and characterization of small molecule PGAM1 inhibitor, PGMI-004A.
(A) Schematic representation of the primary and secondary screening strategies to identify lead compounds as PGAM1 inhibitors.
(B) Structure of alizarin and its derivatives alizarin Red S and PGAM inhibitor (PGMI)-004A.
(C) PGMI-004A inhibits PGAM1 with an IC50 of 13.1 μM, which was determined by incubating purified human PGAM1 proteins with increasing concentrations of PGMI-004A. The error bars represent mean values +/− SD from three replicates of each sample.
(D) Kd value was determined as 7.2±0.7 μM by incubating purified human PGAM1 proteins with increasing concentrations of PGMI-004A. The fluorescence intensity (Ex: 280nm, Em: 350nm) from Tryptophan was measured (Schauerte and Gafni, 1989).
(E) Competitive binding assay of PGMI-004A with recombinant PGAM1 protein in the presence of increasing concentrations of PGAM1 substrate 3-PG. Increased free PGAM1 was determined by an increase in fluorescence intensity.
(F) Dixon plot analysis of PGAM1 enzyme assay in the presence of different concentrations of PGMI-004A and 3-PG. The reaction velocity (v) was determined by the rate of the decrease in fluorescence (ex: 340nm, em: 460nm) by NADH oxidation. Ki was determined to be 3.91±2.50μM.
(G) Thermal shift melting curves of PGAM1 and PGMI-004A. Thermal shift assay was performed to examine the protein (PGAM1) and “ligand” (inhibitor PGMI-004A) interaction. Change of melting temperature (Tm) in a dose-dependent manner at concentrations from 2.5μM to 80μM demonstrates that PGMI-004A directly binds to the protein. Kd for PGAM1-PGMI-004A interaction was determined to be 9.4±2.0μM.
See also Figure S4.

